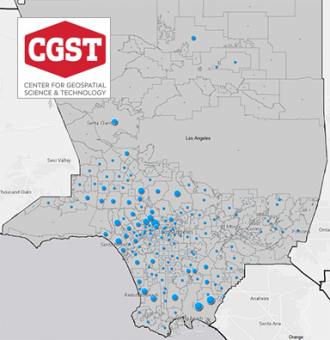
Los Angeles County COVID-19 Cases by City/Community (Photo: Cal-State University, Northridge)
Highest COVID-19 Rates Highest in Democrat-Controlled West LA and Hollywood
Survey: Coronavirus has a social location and is not evenly distributed throughout Los Angeles County
By Wayne Lusvardi, April 4, 2020 5:51 pm
Covid-19 has a social location and is not evenly distributed throughout Los Angeles County. The highest rates of Corona-Virus outbreak in Los Angeles County are in Democrat-controlled West Los Angeles and Hollywood, with predominantly white ethnicity and white-collar occupations. However, Corona-virus is only moderately associated with Asian, Latino and Black communities in LA County in Democrat-Party controlled lower-income, blue-collar areas. Conversely, the lowest relative Covid-19 rates are in Republican suburbs of Eastern LA County of mixed ethnicities and mixed blue and white-collar occupations. This suggests behavioral factors are implicated in Covid-19.
According to data compiled by the Los Angeles County Department of Public Health (LACDPH), there have been 3,352 laboratory-confirmed cases and 65 deaths from Covid-19 virus in Los Angeles County since late February 2020. This equates to a 1.9 percent mortality rate out of all cases or 6.5 deaths out of every 1 million persons in the county or 335 cases per 1 million persons.
Public health data has been sorted in the data tables below by the highest, lowest and moderate rate of cases, not by deaths.
Location
The highest rates of Covid-19 cases are located in Democrat West Los Angeles and Hollywood communities (103 to 201 cases per 100,000) compared to Republican suburbs in East LA County with the lowest case rate (0 to 17 cases per 100,000). A moderate level of rate of cases is located in Democrat Central Los Angeles in lower-income communities (15 to 34 cases per 100,000).
Age
The typical age for contracting the virus ranges from 18 to 65, with the largest cluster in the 41 to 65 age range, with only 20 percent in the elderly 65 and above age group. Less than 1 percent are children under age 18.
Income
Income is bimodal – meaning greater income is associated with both the highest disease rates (Democrat West LA) and the lowest rates (Republican Eastern suburbs). Those living in Central LA County with the lowest household income levels ($29,477 median income) have a moderate disease rate.
Occupation
Occupation is highly associated with a higher rate of cases of Covid-19. White collar communities clustered in Democrat West LA County have much higher rate of cases (134 out of every 100,000) than in suburban Republican Eastern LA County with mixed blue collar and white-collar occupations (10.5 out of every 100,000).
Ethnicity
The strongest ethnic association with high Covid-19 case rates is the general category “White.” The weakest ethnic association is “Asian” as shown in Data Table D below.
Summary
The sorting of data below indicates some of the stereotypes circulating in the media about Covid-19 are erroneous in LA County:
- Areas with high Chinese ethnicity are not related to Covid-19 prevalence.
- The vulnerable elderly do not necessarily have a higher proportion of cases
- Lower income communities living in dense family networks do not have a significantly higher incidence of cases.
- More religiously observant Republicans in Eastern LA County apparently did not spread Covid-19 more than less-religious communities in West LA up to the March 20 “shelter-in-place” order.
- There have been only 5 cases of Covid-19 out of 2,500 homeless persons on skid row in Downtown LA (0.20% rate) indicating the homeless have one of the lowest rates of virus cases in the County despite their living conditions and density.
This brief, non-scientific, survey also suggests that 1) there are other social and behavioral factors involved in the origin and spread of Covid-19; and 2) that the public health policies of social distancing and shut downs of non-essential businesses and churches and synagogues are not targeted to those more likely, but unexplained, factors. Readers are cautioned that correlation does not mean causation.
Table A – Representative Highest Rate Cov-19 Cases – LA County (All Democrat)
|
Area/City (Persons per Household) |
Cases |
Cases/100,000 (Rounded) |
Median HH Income |
Ethnicity |
Avg. Age In years for Area (rounded) |
Preponderant Occupation |
|
Hancock Park LA |
33 |
201 |
$85,277 |
71% white |
42 |
83% white collar |
|
City of West Hollywood (1.5 per HH) |
64 |
179 |
$69,249 |
81% white |
39 |
81% white collar |
|
Melrose, LA (N/A) |
104 |
134 |
$54,183 |
80% white |
39 (18% >65) |
81% white collar |
|
Brentwood District, LA (2.0 per HH) |
39 |
125 |
$112,927 |
84% white |
44 |
>80% White collar |
|
City of Beverly Hills |
39 |
112 |
$96,312 |
82% white |
44 (18% > 65) |
>80% White collar |
|
Hollywood Hills, LA |
32 |
111 |
$69,277 |
74% white |
39 |
White collar |
|
Hollywood, LA |
67 |
103 |
$33,694 |
42% Latino |
31 |
Mixed |
|
378 |
138 average 134 median |
$74, 417 avg. $69,277 med |
White |
41 avg. |
White collar |
Data Table B – Representative Lowest Covid-19 Rates – LA County (all Republican)
|
City |
Cases |
Rate/100,000 |
Median HH Income |
Ethnicity (Rounded) |
Avg. Age |
Preponderant Occupation |
|
Whittier |
15 |
17 |
$66,891 |
67% Latino |
35 |
Blue collar |
|
San Dimas |
5 |
15 |
$84,953 |
61% white |
42 |
Mixed |
|
Glendora |
7 |
13 |
$81,336 |
67% white |
42 |
White collar |
|
Diamond Bar |
6 |
10.5 |
$92,414 |
43% Asian |
43 |
White collar |
|
La Verne |
2 |
6 |
$83,352 |
49% white, 36% Asian |
44 |
Mixed |
|
Bradbury |
0 |
0 |
$123,777 |
66% white, 19% Asian |
48 |
White collar |
|
Rolling Hills |
0 |
0 |
$184,777 |
76% white |
51 |
White collar |
|
8.8 avg. 10.5 median |
Data Table C – Representative Moderate Covid-19 Rates in Blue Collar, All Democrat Areas
|
Area |
Cases |
Rate per 100,000 (Rounded) |
Median HH Income |
Ethnicity |
Avg. Age in Years |
Preponderant Occupation |
|
Koreatown, LA |
18 |
34 |
$30,558 |
53% Latino |
35 |
Mixed |
|
Florence, LA |
14 |
28 |
$29,447 |
86% Latino |
28 |
Blue collar |
|
South Park, LA |
11 |
28 |
$29,518 |
79% Latino |
32 |
Blue collar |
|
Westlake, LA |
13 |
22 |
$26,757 |
73% Latino |
N/A |
Blue collar |
|
Pico-Union, LA |
9 |
21 |
$26,424 |
85% Latino |
33 |
Blue collar |
|
Watts, LA |
7 |
16 |
$25,161 |
62% Latino 37% Black |
25 |
Blue collar |
|
Lincoln Heights, LA |
5 |
15 |
$30,579 |
71% Latino |
27 |
Blue collar |
|
77 |
23 |
$29,447 med |
Mixed |
30 |
Blue collar |
Data Table D – Representative Asian Communities in LA County – Covid-19 Cases (Mixed Political Affiliation)
|
City/Area |
Cases |
Cases/100,000 (Rounded) |
Median HH Income |
Ethnicity (Rounded) |
Avg. Age (Rounded) |
Predominant Occupation |
|
Alhambra (2.8 per HH) |
13 |
15 |
$57,115 |
51% Asian |
38.5 (16.9% > 65) |
White collar |
|
Monterey Park |
9 |
15 |
$55,117 |
67% Asian |
45 (18.4% >65) |
Mixed |
|
Arcadia (3 per HH) |
0 |
0 |
$92,102 |
61% Asian |
44 years |
White collar |
|
22 |
10 average |
$68,110 avg. |
60% |
42.5 |
White collar |

- Peter Gleick’s National Water Plan for California - October 12, 2020
- Court Opens Up Big Prop.13 Loophole for ‘Public Franchise Fees’ - October 2, 2020
- New Cal Grid CEO is Ex-Enron Green Power Trader - September 29, 2020
RELATED ARTICLES
-
-
-
 August 27, 2020
Glad to see this from Wayne Lusvardi, one of a handful of fact-driven, truth-telling policy writers in California.
Ignored or otherwise glossed over in this study is that West Los Angeles and Hollywood (as well as the West San Fernando Valley) are heavily Jewish. As a group, Ashkenazi Jews are famously unhealthy, prone both to genetic diseases as a general as well as (by simple observation) chronic, background ill health. Although in the study they are listed as “White,” it would be interesting to know what percentage are of the infected/diseased are in fact of the majority Ashkenazim/Eastern European ancestry in these areas.
Just a thought.
VicB3