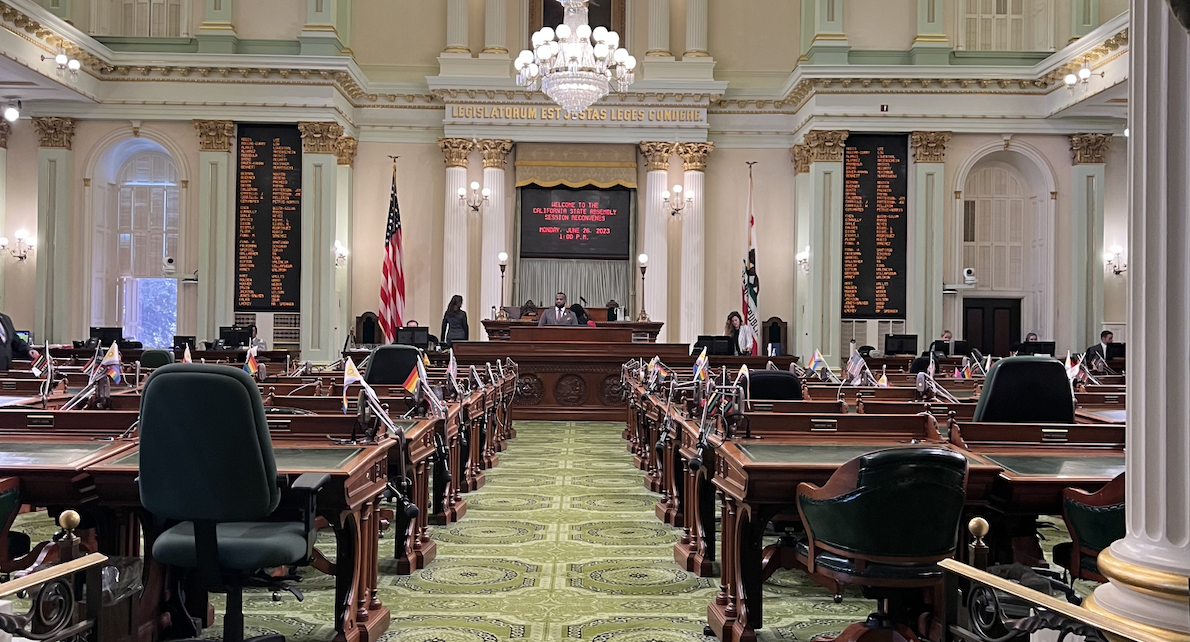
California State Senate Chambers. (Photo: Katy Grimes for California Globe)
Additional Categories of Bills Over the Past Few Sessions
1,316 bills or 29% contained a state-mandated local program
By Chris Micheli, September 23, 2023 3:45 pm
Last week, I put together a chart from the past fifteen years of the California Legislature and the number of bills each 2-year Session under 14 categories in comparison to the number of bills introduced that session. In the following chart, I came up with eight additional categories of bills that can be tracked and examined.
The following is the chart and per Session data:
| Session | Sunset Date | Contingent Enactment | Double-Jointed | Pilot Project | Applies to All Cities | Retroactive Effect | Public Right of Access Disclaimer | Disclaim Gift of Public Funds |
| 2023 | 257 | 7 | 102 | 45 | 63 | 59 | 71 | 22 |
| 2021 – 22 | 485 | 16 | 221 | 90 | 82 | 137 | 156 | 43 |
| 2019 – 20 | 422 | 10 | 140 | 75 | 74 | 171 | 129 | 18 |
| 2017 – 18 | 415 | 4 | 213 | 92 | 15 | 99 | 110 | 11 |
| 2015 – 16 | 372 | 6 | 188 | 83 | 4 | 114 | 100 | 9 |
| 2013 – 14 | 344 | 7 | 172 | 80 | 2 | 85 | 55 | 15 |
| 2011 – 12 | 401 | 7 | 154 | 77 | 19 | 109 | 21 | 3 |
| 2009 – 10 | 400 | 7 | 145 | 80 | 7 | 149 | 24 | 6 |
CMM 9/23/23

Chris Micheli is an attorney and lobbyist with Snodgrass & Micheli, LLC, as well as an Adjunct Professor at McGeorge School of Law.
Latest posts by Chris Micheli (see all)
- Committee Versus Floor Lobbying - March 1, 2026
- Fishing Traps in California - March 1, 2026
- What Type of Lobbyist Do You Want to Be? - February 28, 2026
RELATED ARTICLES
-
 September 20, 2023
 -
 September 29, 2022
 -
 September 7, 2020