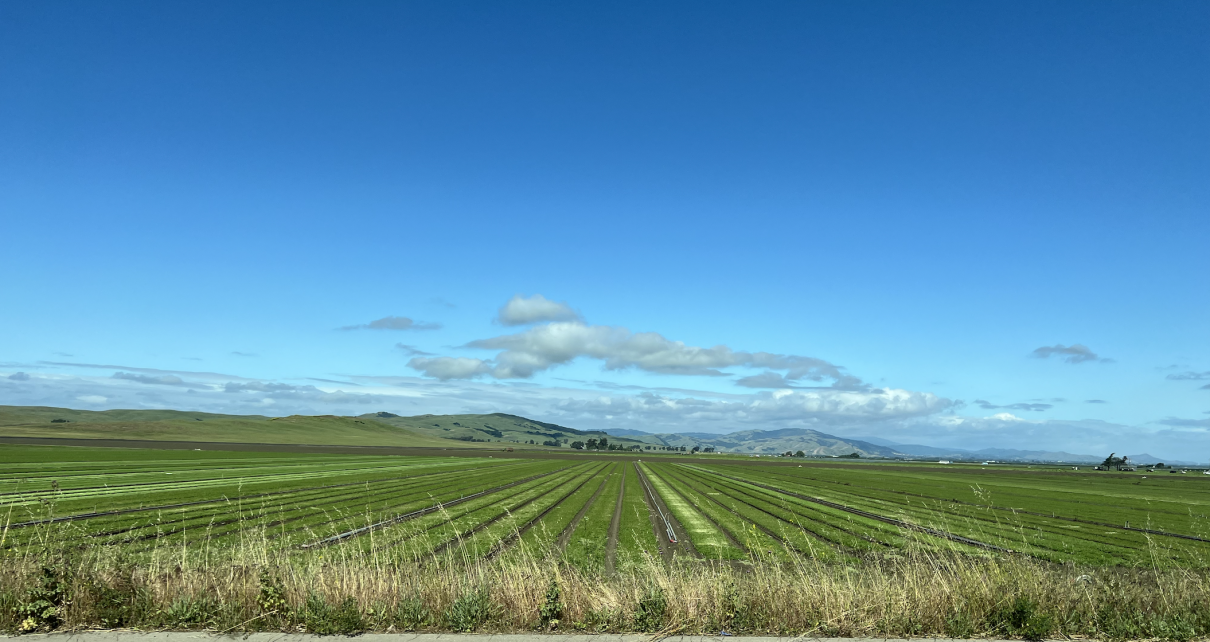
Beautiful California agriculture. (Photo: Katy Grimes for California Globe)
Ringside: An Overview of California’s Water Economy
An encouraging fact: we are already very good at water conservation
By Edward Ring, July 13, 2024 10:06 am
 If energy powers civilization, water gives it life. One of the biggest challenges of our time is to develop the means to deliver both of these essentials in abundance, while also keeping them affordable and ecologically sustainable. We believe this is possible with common sense solutions that balance the needs of people with the needs of the environment. Over the past two weeks we have presented an overview of California’s energy economy, and proposed ways in which California can restore the availability of abundant and affordable energy. This week we begin a two-part discussion of how to accomplish this objective with water.
According to data compiled by the California Department of Water Resources, over the 10-year period from 2011 through 2020, on average California receives about 200 million acre-feet (MAF) of rain each year. The potential for multi-year droughts along with occasional very wet years necessitates a robust system of water storage and distribution. Before discussing what we should add to this system, and how to prioritize the maintenance and upgrades of what we’ve already got, it’s necessary to know how we currently use water in the state.
An excellent compilation of how much water Californians use come from the California Farm Bureau. This report presents data from a wet year (2006), when 251 MAF rained onto California, compared to a dry year, when the state only received 103 MAF of rain. It differentiates between “captured” and “uncaptured” water. Using the wet and dry years as examples, it shows that in the wet year, 41 percent of the runoff was captured (104 MAF), and in the dry year, 59 percent was captured, which still only totaled 61 MAF.
The report then breaks the use of captured water into three categories: the amount released back into the rivers to benefit the environment, irrigation for agriculture, and urban use. There are two main points to take away from this report. First, the basic numbers: California’s water withdrawals for agriculture generally total around 30 MAF/year, and for urban use around 9 MAF/year. Second, it can be misleading to differentiate between captured water – typically stored in a reservoir – that is later released to support ecosystem health, and uncaptured water – which never is withdrawn and stored. The numbers can be surprising.
For example, using the average of 200 MAF/year of total water supplied to the state in the form of precipitation, 81 percent is reserved for the environment, with 15 percent used for farm irrigation and 4.5 percent for urban use. This is probably a more accurate way to assess how much of California’s water is being diverted from the environment, although to be fair, much of this uncaptured water is in California’s far north, and has little to do with the impact of water withdrawals in the San Joaquin Valley.
But to better understand that impact, and what might be done to protect farmers while also restoring ecosystem health, there is another indispensable report. The key to irrigating the San Joaquin Valley rests in how runoff from the river systems are managed that feed the Sacramento-San Joaquin Delta. If too much water is taken out of the delta at the wrong time, it causes damage to habitat and wildlife. But if millions of acre feet could be safely diverted from the delta during major winter storms, everyone would win – farmers and ecosystems. How much water?
According to data maintained and presented by the California Dept. of Water Resources, a great deal of water. This interface at CDWR’s “Data Exchange Center” will permit anyone with an internet browser to monitor the volume of daily and historic flows out of the delta into the San Francisco Bay. To get data on total delta outflow, in the box for Station ID, enter “DTO,” and in the box for Sensor Number enter “23”. You can select a start date and end date, and view data.
There’s one more thing to be aware of before diving into this report. The information is reported in cubic feet per second (CFS), which is a common unit to measure flow. Just remember that acre feet per day (AF/day) can be calculated by multiplying CFS by 1.983. For most practical purposes, that means if you want to intuitively know AF/day and all you’ve got is CFS, just multiply by two. 2X CFS = AF/day.
If you use this database, what you will learn is that literally hundreds of thousands of acre feet per day flow out of the delta and into the San Francisco Bay for weeks on end during winter storms. Meanwhile, you can use this same interface to monitor how much of it actually gets pumped into the southbound aqueducts to supply California’s farms and cities. The state’s main pumps are Station ID “CLC” and Sensor Number “273.” The federal pumps are Station ID “TRP” and Sensor Number “70”.
This report is a useful tool for anyone who wants to monitor or influence water policy in California. It will reveal that even during very wet winters, usually only a small fraction of delta outflow is diverted for agricultural or urban use. The Public Policy Research Institute has estimated that in an average year over 10 million acre feet of water flows into the San Francisco Bay in excess of what is required for ecosystem health. If there were a safe way to remove and store just a bit more of this uncaptured water, it would eliminate water scarcity in California.
It is pertinent to conclude this overview with an encouraging fact: we are already very good at water conservation. According to this study from the Pacific Institute, urban water use peaked around 2005 at nearly 10 MAF/year, then declining to under 8 MAF/year despite population growth. As for agricultural water use, it has remained consistent at around 30 MAF/year, even though the productivity of California’s farmland has nearly doubled over the past few decades through the introduction of higher value crops and tremendous innovations in irrigation efficiency.
Next week’s newsletter will discuss some of the good and not-so-good ways to increase water availability in California.


RELATED ARTICLES
-
 June 27, 2024
 -
 September 10, 2020
 -
So the Public Policy Research Institute has estimated that in an average year over 10 million acre feet of water flows into the San Francisco Bay in excess of what is required for ecosystem health, and Mr. Ring correctly concludes that if there were a safe way to remove and store just a bit more of this uncaptured water, then it would eliminate water scarcity in California. The problem is that Newsom and legislative Democrats that control California want water scarcity and they deliberately create water scarcity through their policies and legislation? It’s one of the tools that Democrats use to control Californians and make them dependent and subservient?
Water Flows To Foreign Countries, too. http://ahiddenhistory.substack.com/p/california-to-permanently-restrict