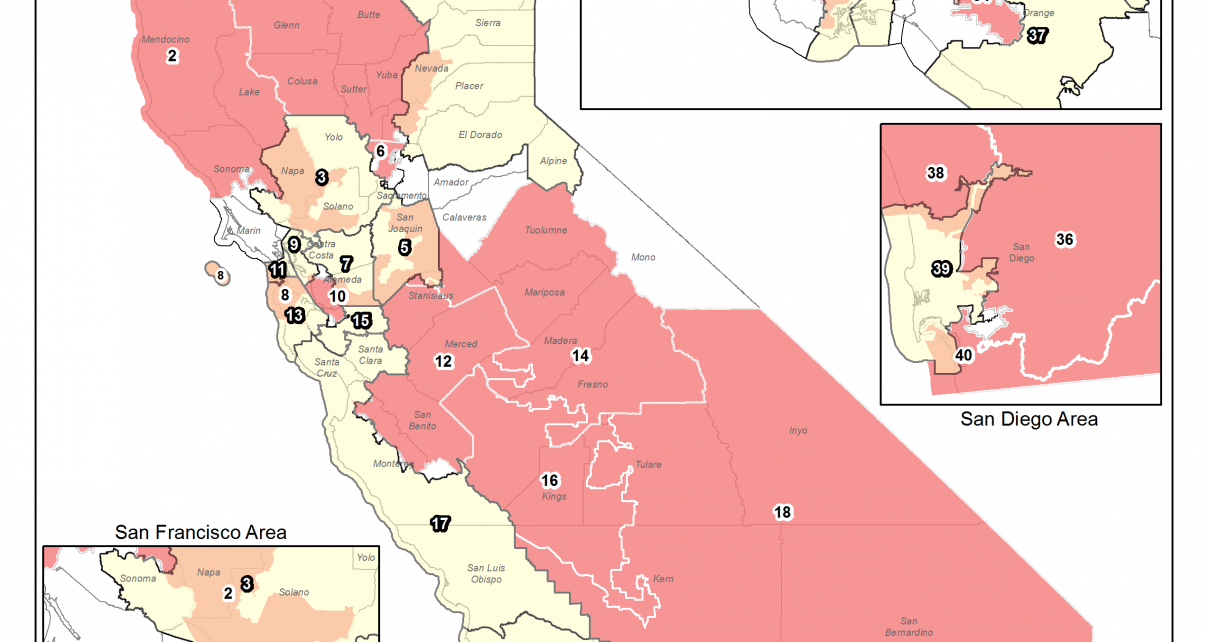
California state legislative districts. (Photo: Legislature.ca.gov)
California Citizens Redistricting Commission: Are all votes created equal?
Should should these figures be considered by the Redistricting Commission as it draws its lines?
By Thomas Buckley, December 9, 2021 2:45 pm
As the California Citizens Redistricting Commission wends its way to finalizing mapping out the lines that will define the state’s politics for the next ten years, there are a number of factors they will be considering.
General population figures, existing city boundaries, county boundaries, and natural boundaries can all factor into exactly how the Assembly, State Senate, Congressional and other districts are formed. Also, “Communities of Interest” can play a role in the determination, as do the strictures of the federal Voting Rights Act which are meant to ensure that minority group representation is properly taken into account and not purposefully diluted.
What cannot, it seems, be considered, however, is how many people in a given district are legally allowed to vote or what percentage of legal voters actually vote in any given election. A review of the 2020 State Assembly voting patterns show clearly that districts that have lower turnouts and/or higher percentages of non-citizen residents tilt decidedly in favor of one party – the Democrats.
Note: The numbers used in this article are based on both the actual vote totals of each of the eighty-2020
Assembly races and the figures used by the previous Redistricting Commission. A review of the Senate numbers revealed a similar pattern. Additionally, the transparency travails of the Commission have been well-documented, bringing even more questions into the process.
In 2020, there were 59 competitive Assembly races, “competitive” being defined as having both a Republican and a Democrat in the November General Election. The remaining 21 seats either had two members of the same party, one party versus a member of a third party or write-in or independent, or were not contested.
In the contested races, the average turnout was about 207,000 people per district, with each district having approximately 500,000 residents. In districts that had higher turnout – more than 250,000 votes cast, or about 20 percent above the average – four races were won by a Republican and five were won by a Democrat.
In the lower turnout districts – defined by being under 170,000 votes cast or about 18 percent below the average – one Republican was elected while 10 Democrats prevailed.
When compared to statewide party registration numbers, the high turnout districts should have elected five Democrats and three Republicans while the low turnout district split should have been four Republicans and seven Democrats, a shift of two seats to the Democrats (obviously there are numerous other factors in play and each election has its own issues so no “shift” can be guaranteed).
Interestingly, on the rare occasion when a Republican won any district, they received about 56 percent of the vote cast, while Democrats who prevailed received 67 percent of the vote. Additionally, Republican won districts had a turnout figure of about 223,000 total votes while Democrat victories occurred in districts with an average turnout of 200,000 votes, or about 10 percent less (the previous 207,000 statewide figure is an average of all competitive districts no matter who won).
The citizenship numbers also show distinct differences. According to the figures, only about 78 percent of Californian’s old enough to vote are legally allowed to vote. This non-voting population is made up of various groups, including those in the state on work visas, long-term permanent residents (“green card” holders), and – the largest group – non-citizen permanent (or illegal, depending upon the choice of terminology) residents.
An average district has about 275,000 legal voters. Districts that have more than 300,000 legal voters (about 10 percent higher than the average) returned seven Republicans, 16 Democrats, and one independent, results roughly in line with statewide party registration figures.
But districts that have fewer than 250,000 legal voters showed a very significant tilt, electing three Republicans and 17 Democrats, more than twice the difference that could be expected vis a vis statewide party affiliations.
It should be noted that the turnout and citizen rates appear to be intertwined. The competitive districts with the highest percentages of citizens had the highest turnouts, with the top eight turnout districts showing an average citizenship rate of 87 percent, while the lowest 10 districts by turnout carried a citizenship rate of 62 percent (Republicans and Democrats split the top eight districts four to four while the lowest went Democrat by nine to one).
So are these figures merely statistical artifacts or should they be considered by the Redistricting Commission as it draws its lines? To this point, redistricting programs across the country do not consider citizenship in their calculations as it is widely assumed that to do so is illegal. However, it should be noted that previous legal challenges calling for re-districting by actual citizenship figures rather than gross body count have failed, but they have failed typically over the issue of “standing,” at least at the federal level, and not on the merits of the cases.
A corollary issue is what impact do these figures have on exactly who gets elected. As noted previously, there are myriad different aspects involved in each and every election at every level so determining if these seemingly obvious imbalances are merely coincidental, interestingly correlative, or actually causative to the point that the make-up of the state legislature is significantly altered is extremely difficult to determine. However, should (or can) redistricting take these factors into consideration, is the “one person, one vote and every vote is equal” principle hopelessly skewed by the unambiguous figures, and, therefore, do these clear deviations from the norm rise to the legally actionable levels referred to in other court rulings?
Sadly, one doubts the Democratic Attorney General or the Democrat super-majority in the legislature want to find out.
Lastly, one can safely assume that if the Republicans had an equivalent stranglehold on California politics they wouldn’t want to find out, either.
And be sure to take a look at this issue at the federal level.

- Benefit Fraud Problems and Solutions - November 7, 2024
- A Little Exit Poll - November 5, 2024
- Tomorrow’s Headlines Today! - November 5, 2024
RELATED ARTICLES
-
-
 August 5, 2020
 -
 August 4, 2020
“To this point, redistricting programs across the country do not consider citizenship in their calculations as it is widely assumed that to do so is illegal. ”
And HEREIN lies much of the problem with California elections… along with VOTER ROLLS that NEVER get PURGED and voting systems with security exploits that are DOCUMENTED by a third-party security testing firm in PDF’s on the California Secretary of State’s website, explained away and then SIGNED FOR by Alex Padilla, who has conveniently now skated off to even GREATER corruption on a Federal scale in Washington D.C….
And maybe the “jungle primary” thing isn’t working? Maybe time to rethink the 2012 “Ah-nuld” Schwarzenegger theory.
Don’t include noncitizens in the census.
I am pretty sure some of these districts stretch south all the way to Argentina if you know what I mean.
Redistricting in a deep blue state?? I’m sure it will be fair and impartial. What could go wrong?