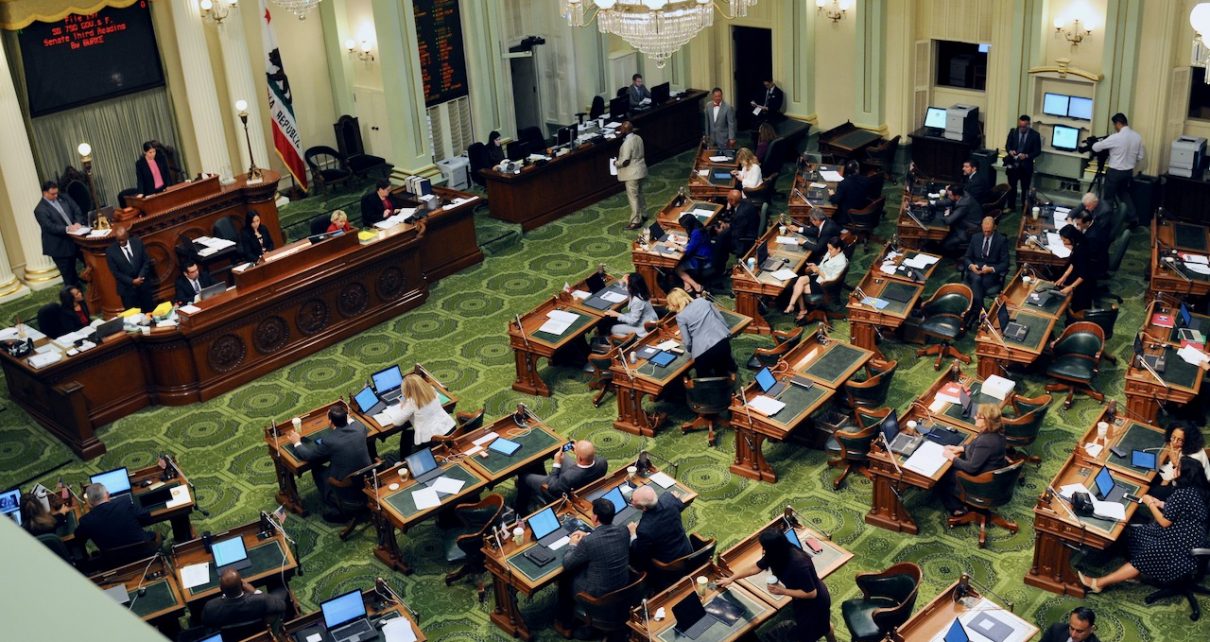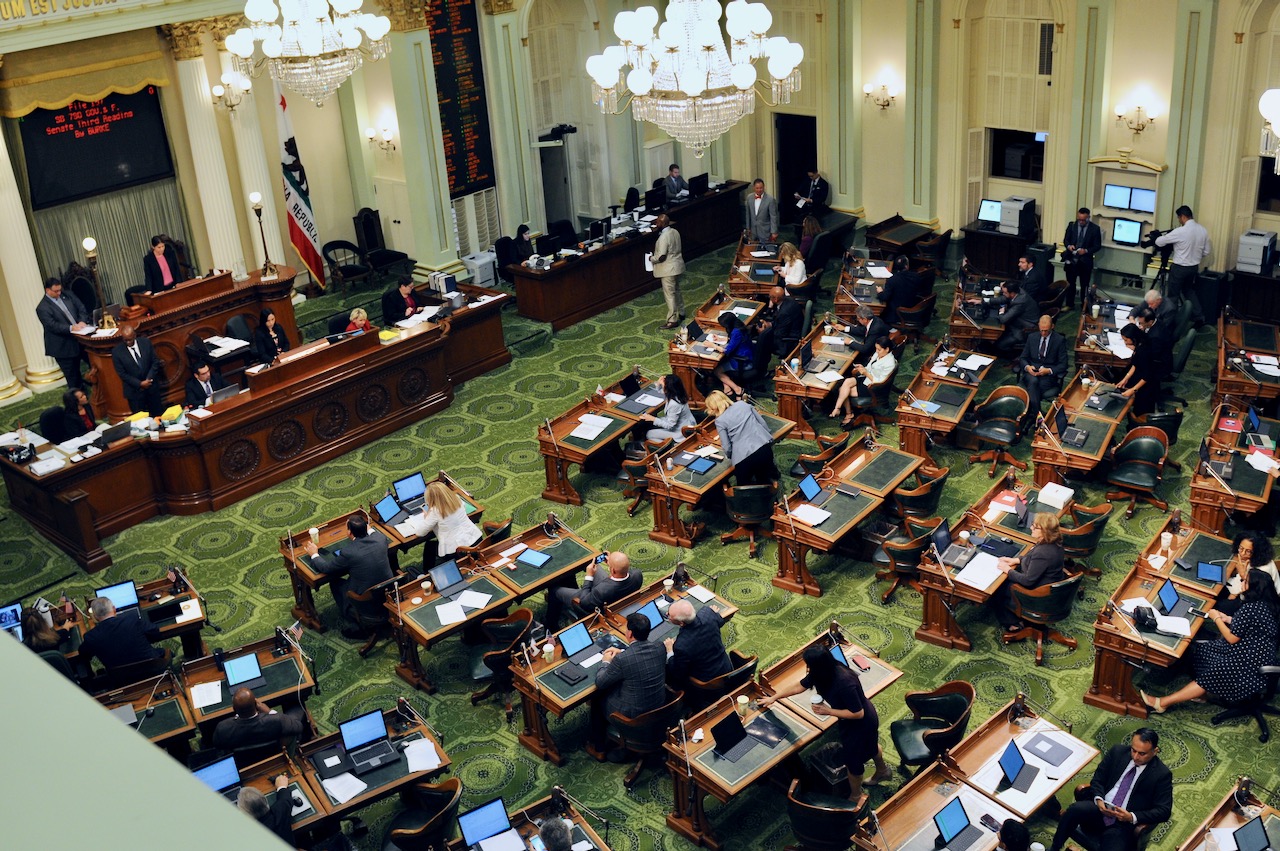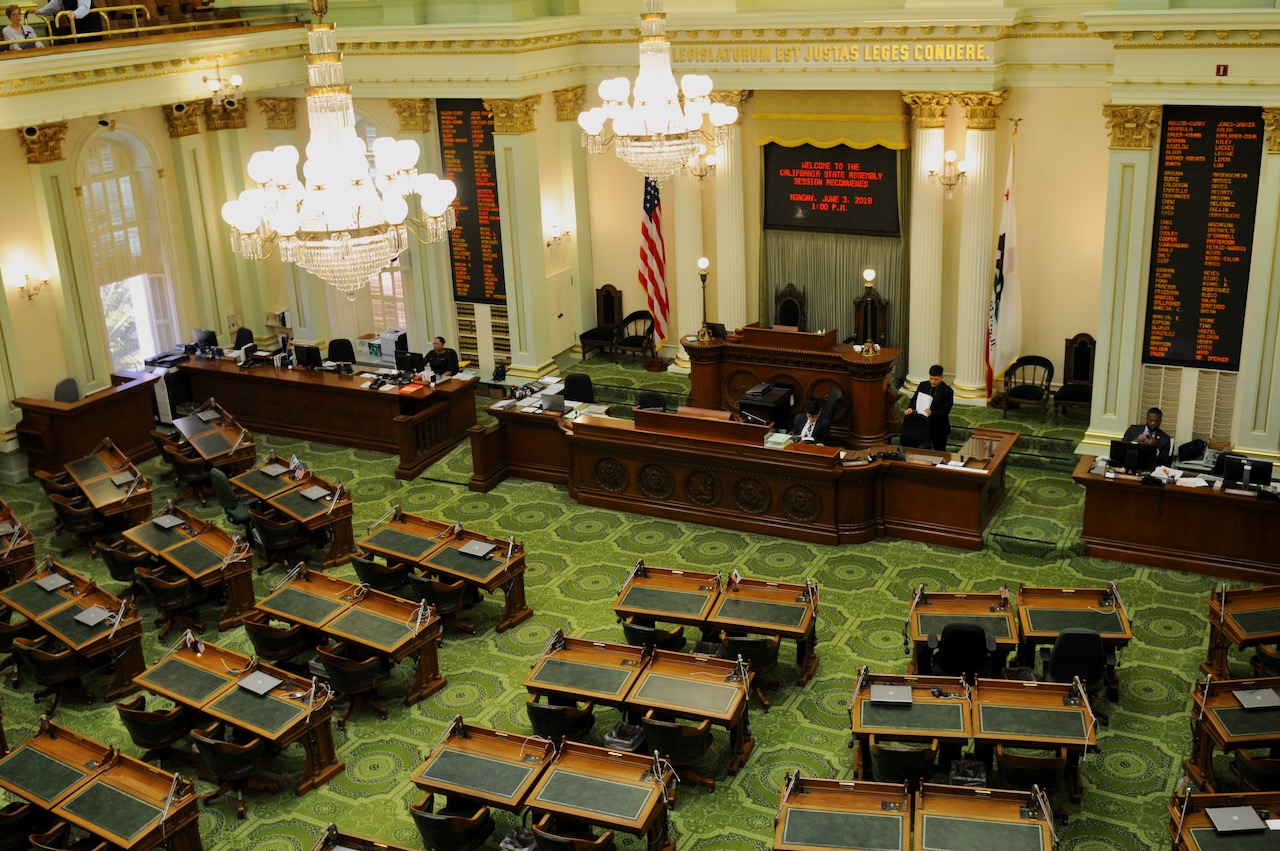
California State Assembly Chamber. (Photo: Kevin Sanders for California Globe)
Categories of Bills per Legislative Session
In the 2021-22 Session, the total number of Assembly Bills and Senate Bills introduced was 4,476
By Chris Micheli, September 20, 2023 4:52 pm
In reviewing bills over the past fifteen years in the California Legislature, I compiled the following chart which includes some of the common categories of bills. The chart is broken down by session year and number of bills introduced. Thereafter, among those introduced bills, there are fourteen categories that are listed along with how many bills each year that fit within each of those 14 categories, and the percentage of those types of bills in comparison to the number of bills introduced that session.
For the past seven 2-year Sessions, the numbers are cumulative for those two years and combine Assembly Bills and Senate Bills. For the 2023 Session, the numbers obviously only include the recently-concluded Session, but include all ABs and SBs introduced this past year.
To review the chart, for example in the 2021-22 Session, the total number of ABs and SBs introduced was 4,476. Of those 4,476 bills introduced, 4,077 bills or 91 % of the total introduced bills required a majority vote; 205 of the introduced bills or 5% contained an urgency clause; 342 bills or 8% made an appropriation; 141 bills or 3% were special (rather than general) statutes; 1,316 bills or 29% contained a state-mandated local program; 3,741 bills or 84% were keyed fiscal; 1,120 bills or 25% made legislative findings and declarations; 963 or 22% made statements of legislative intent; 151 bills or 3% were tax levies; 80 bills or 2% contained a severability clause; 483 bills or 11% were ones that would take immediate effect upon enactment (there are four types of bills that fall under this category); 399 bills or 9% required a vote higher than majority for passage; 735 bills or 16% were non-fiscal measures; and, 135 bills or 3% contained a named act.
The following are the statistics for the past 15 legislative years:
| Session Year | Number of Bills Introduced | Majority Vote Required | Contains Urgency Clause | Makes an Appropriation | Is a Special Statute | Mandates Local Program | Keyed Fiscal | Makes Legislative Findings | States Legislative Intent | Is a Tax Levy | Contains Severability Clause | Takes Immediate Effect | Higher Vote Required | Non-fiscal | Names the Act |
| 2023 | 2,662 | 2,480 (93%) | 89 (3%) | 148 (6%) | 88 (3%) | 760 (29%) | 2,099 (79%) | 710 (27%) | 717 (27%) | 67 (3%) | 36 (1%) | 218 (8%) | 182 (7%) | 563 (21%) | 84 (3%) |
| 2021 – 22 | 4,476 | 4,077 (91%) | 205 (5%) | 342 (8%) | 141 (3%) | 1,316 (29%) | 3,741 (84%) | 1,120 (25%) | 963 (22%) | 151 (3%) | 80 (2%) | 483 (11%) | 399 (9%) | 735 (16%) | 135 (3%) |
| 2019 – 20 | 4,848 | 4,446 (92%) | 197 (4%) | 303 (6%) | 139 (3%) | 1,281 (26%) | 3,779 (78%) | 1,108 (23%) | 1,031 (21%) | 165 (3%) | 65 (1%) | 432 (9%) | 402 (8%) | 1,069 (22%) | 130 (3%) |
| 2017 – 18 | 4,775 | 4,349 (91%) | 202 (4%) | 402 (8%) | 170 (4%) | 1,223 (26%) | 3,692 (77%) | 1,006 (21%) | 912 (19%) | 195 (4%) | 35 (.7%) | 508 (11%) | 426 (9%) | 1,083 (23%) | 101 (2%) |
| 2015 – 16 | 4,418 | 4,037 (91%) | 255 (6%) | 354 (8%) | 3 (.06%) | 1,115 (25%) | 3,399 (77%) | 964 (22%) | 881 (20%) | 169 (4%) | 28 (.6%) | 498 (11%) | 381 (9%) | 1,019 (23%) | 110 (2%) |
| 2013 – 14 | 4,233 | 3,822 (90%) | 284 (7%) | 333 (8%) | 6 (.1%) | 1,022 (24%) | 3,155 (75%) | 900 (21%) | 836 (20%) | 172 (4%) | 44 (1%) | 531 (13%) | 411 (10%) | 1,078 (25%) | 104 (2%) |
| 2011 – 12 | 4,280 | 3,952 (92%) | 288 (7%) | 327 (8%) | 13 (.3%) | 963 (23%) | 3,115 (73%) | 895 (21%) | 930 (22% | 143 (3%) | 46 (1%) | 523 (12%) | 328 (8%) | 1,165 (27%) | 108 (3%) |
| 2009 – 10 | 4,294 | 4,158 (97%) | 458 (11%) | 310 (7%) | 20 (.5%) | 981 (23%) | 3,481 (81%) | 922 (21%) | 1,076 (25%) | 214 (5%) | 34 (.8%) | 645 (15%) | 136 (3%) | 813 (19%) | 103 (2%) |
| Averages Over 15 Years | 4,248 | 4,037 (95%) | 247 (6%) | 315 (7%) | 73 (2%) | 1,083 (25%) | 3,308 (78%) | 953 (22%) | 918 (22%) | 160 (4%) | 46 (1%) | 480 (11%) | 333 (8%) | 941 (22%) | 109 (3%) |
CMM 9/20/2023
As a result of these statistics, legislative observers could say that, on average over the past 15 years, the California Legislature has introduced 4,248 bills during its two-year sessions and, of those 4,248 bill introductions, over an average of two years, the following types of bills and the following percentages of those introduced bills are:
- 95% require a majority vote
- 6% contain an urgency clause
- 7% make an appropriation
- 2% are special statutes
- 25% contain a state-mandated local program
- 78% are keyed fiscal
- 22% contain legislative findings and declarations
- 22% contain legislative intent statements
- 4% are tax levies
- 1% contain a severability clause
- 11% would take effect immediately (there are four types of bills in this category)
- 8% require a higher vote threshold than a majority vote, including 2/3, 4/5, etc.
- 22% are non-fiscal
- 3% would name the act contained in the bill
- Exchange Services for Supervised Child Visitation - February 6, 2026
- General Provisions on Enforcement of Judgments - February 5, 2026
- Fish and Game Management - February 5, 2026


