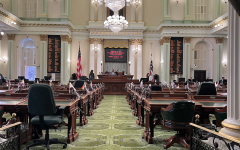
The Legislative Bill Room, California State Capitol. (Photo: ca.gov)
Disposition of California Assembly Bills
There are averages for each of these figures based upon the 16-year cumulative data
By Chris Micheli, October 3, 2024 3:15 pm
Over the past sixteen years, I have tracked by each year of the 2-year California Legislative Sessions a series of actions related to bills. The following chart lists those seven actions per session year. The first figure is the number of Assembly Bills introduced each year; the second figure is the number of those ABs that passed off the Assembly Floor (and the percentage this figure represents of ABs introduced); the third figure is the number of ABs that were refused passage on the Assembly Floor, but excluding those that were granted reconsideration; the fourth figure is the number of ABs that did not reach the Assembly Floor (and the percentage this figure represents of ABs introduced); the fifth figure is the number of ABs enrolled and sent to the Governor’s Desk; the sixth figure is the number of ABs signed into law by the Governor (i.e., chaptered); and, the seventh figure is the number of ABs vetoed by the Governor. At the bottom of this chart, I include averages for each of these figures based upon the 16-year cumulative data.
| Session Year | ABs Introduced | ABs Passed by the Assembly | ABs Refused Passage on Assembly Floor | ABs Not Reaching Assembly Floor | ABs Enrolled | ABs Chaptered | ABs Vetoed |
| 2024 | 1,520 | 936 / 62% | 0 | 584 / 38% | 791 | 668 | 123 |
| 2023 | 1,771 | 1,056 / 60% | 1 | 714 / 40% | 665 | 560 | 105 |
| 2022 | 1,383 | 849 / 61% | 9 / 1% | 525 / 38% | 724 | 616 | 108 |
| 2021 | 1,593 | 793 / 50% | 8 | 792 / 50% | 523 | 478 | 45 |
| 2020 | 1,541 | 430 / 28% | 7 | 1,104 / 72% | 291 | 255 | 36 |
| 2019 | 1,833 | 1,040 / 57% | 0 | 793 / 43% | 696 | 574 | 122 |
| 2018 | 1,531 | 942 / 62% | 16 / 1% | 573 / 37% | 809 | 660 | 149 |
| 2017 | 1,733 | 970 / 56% | 1 | 762 / 44% | 652 | 568 | 84 |
| 2016 | 1,388 | 846 / 61% | 19 / 1% | 523 / 38% | 684 | 574 | 110 |
| 2015 | 1,549 | 906 / 58% | 8 / 1% | 635 / 41% | 621 | 527 | 94 |
| 2014 | 1,336 | 852 / 64% | 6 | 478 / 36% | 703 | 605 | 98 |
| 2013 | 1,430 | 766 / 54% | 2 | 662 / 46% | 542 | 485 | 57 |
| 2012 | 1,267 | 743 / 59% | 12 / 1% | 512 / 40% | 640 | 567 | 73 |
| 2011 | 1,433 | 767 / 54% | 7 | 659 / 46% | 513 | 447 + 1 | 65 |
| 2010 | 1,209 | 759 / 63% | 4 | 446 / 37% | 671 | 465 | 206 |
| 2009 | 1,590 | 904 / 57% | 0 | 686 / 43% | 585 | 408 | 177 |
| Averages over past 16 years | 1,506 | 847 / 56% | 6.3 | 653 / 43% | 632 / 42% | 529 | 103 |
- Insignia of Nonprofit Associations - February 19, 2026
- Endangered Species Regulation - February 19, 2026
- Renewal of Judgments - February 18, 2026


