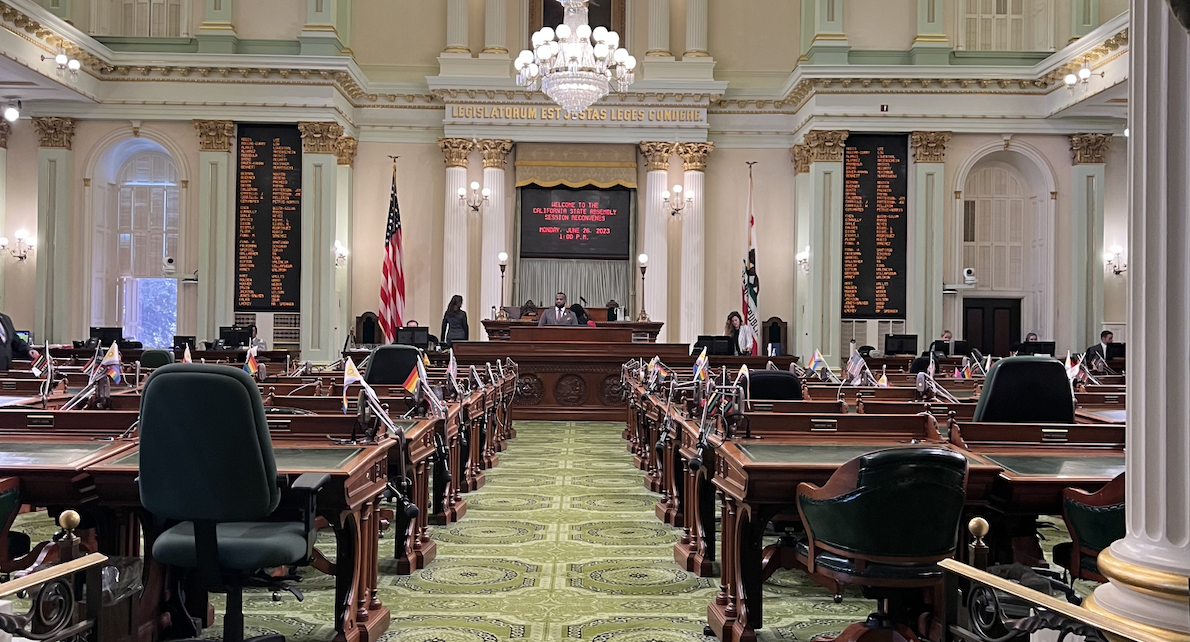
California State Senate Chambers. (Photo: Katy Grimes for California Globe)
Disposition of 2023 Bills in the California Legislature
Includes Averages over past 15 years
By Chris Micheli, October 14, 2023 6:46 am
I researched and compiled the following information regarding the disposition or outcome of legislation from the last 15 years of the California Legislature. The two charts below list the bills by session year, the number of Assembly Bills or Senate Bills (ABs, ABs) introduced that session year, the number of bills passed by the house of origin, the number of bills that failed passage on the floor of the house of origin, the number of bills enrolled and sent to the Governor, the number of bills chaptered, and the number of bills vetoed.
Disposition of California Senate Bills
| Session Year | SBs Introduced | SBs Passed by the Senate | SBs Refused Passage on Senate Floor | SBs Not Reaching Senate Floor | SBs Enrolled | SBs Chaptered | SBs Vetoed |
| 2023 | 891 | 658 / 74% | 0 | 233 / 26% | 381 | 330 | 51 |
| 2022 | 672 | 605 / 90% | 6 / 1% | 61 / 9% | 442 | 381 | 61 |
| 2021 | 828 | 551 / 67% | 0 | 277 / 33% | 313 | 292 | 21 |
| 2020 | 682 | 246 / 36% | 2 | 434 / 64% | 137 | 117 | 20 |
| 2019 | 792 | 562 / 71% | 1 | 229 / 29% | 346 | 296 | 50 |
| 2018 | 694 | 518 / 75% | 3 | 173 / 25% | 408 | 356 | 52 |
| 2017 | 817 | 514 / 63% | 1 | 302 / 37% | 325 | 291 | 34 |
| 2016 | 676 | 483 / 71% | 0 | 193 / 29% | 368 | 319 + 2 w/o signature | 48 |
| 2015 | 805 | 480 / 60% | 0 | 325 / 40% | 320 | 280 | 39 |
| 2014 | 641 | 463 / 72% | 0 | 178 / 28% | 372 | 326 + 1 w/o signature | 45 |
| 2013 | 826 | 499 / 60% | 0 | 327 / 40% | 354 | 315 | 39 |
| 2012 | 632 | 472 / 74% | 5 / 1% | 155 / 25% | 356 | 309 | 47 |
| 2011 | 948 | 511 / 54% | 3 | 434 / 46% | 357 | 297 | 60 |
| 2010 | 662 | 473 / 71% | 1 | 189 / 29% | 358 | 268 | 90 |
| 2009 | 833 | 460 / 55% | 0 | 373 / 45% | 308 | 244 | 64 |
| Averages over past 15 years | 760 | 500 / 66% | 1.5 | 259 / 34% | 344 / 45% | 295 | 48 |
Disposition of California Assembly Bills
| Session Year | ABs Introduced | ABs Passed by the Assembly | ABs Refused Passage on Assembly Floor | ABs Not Reaching Assembly Floor | ABs Enrolled | ABs Chaptered | ABs Vetoed |
| 2023 | 1,771 | 1,056 / 60% | 1 | 714 / 40% | 665 | 560 | 105 |
| 2022 | 1,383 | 849 / 61% | 9 / 1% | 525 / 38% | 724 | 616 | 108 |
| 2021 | 1,593 | 793 / 50% | 8 | 792 / 50% | 523 | 478 | 45 |
| 2020 | 1,541 | 430 / 28% | 7 | 1,104 / 72% | 291 | 255 | 36 |
| 2019 | 1,833 | 1,040 / 57% | 0 | 793 / 43% | 696 | 574 | 122 |
| 2018 | 1,531 | 942 / 62% | 16 / 1% | 573 / 37% | 809 | 660 | 149 |
| 2017 | 1,733 | 970 / 56% | 1 | 762 / 44% | 652 | 568 | 84 |
| 2016 | 1,388 | 846 / 61% | 19 / 1% | 523 / 38% | 684 | 574 | 110 |
| 2015 | 1,549 | 906 / 58% | 8 / 1% | 635 / 41% | 621 | 527 | 94 |
| 2014 | 1,336 | 852 / 64% | 6 | 478 / 36% | 703 | 605 | 98 |
| 2013 | 1,430 | 766 / 54% | 2 | 662 / 46% | 542 | 485 | 57 |
| 2012 | 1,267 | 743 / 59% | 12 / 1% | 512 / 40% | 640 | 567 | 73 |
| 2011 | 1,433 | 767 / 54% | 7 | 659 / 46% | 513 | 447 + 1 | 65 |
| 2010 | 1,209 | 759 / 63% | 4 | 446 / 37% | 671 | 465 | 206 |
| 2009 | 1,590 | 904 / 57% | 0 | 686 / 43% | 585 | 408 | 177 |
| Averages over past 15 years | 1,506 | 842 / 56% | 6.7 | 658 / 44% | 621 / 41% | 519 | 102 |

Chris Micheli is an attorney and lobbyist with Snodgrass & Micheli, LLC, as well as an Adjunct Professor at McGeorge School of Law.
Latest posts by Chris Micheli (see all)
- Property Boundaries - July 30, 2026
- Incidents of Ownership - July 29, 2026
- Wills in California - July 29, 2026
RELATED ARTICLES
-
 September 17, 2022
 -
 January 7, 2022
 -
 February 7, 2020
Interesting data. The last two years of Schwartzenegger’s term were 2009 and 2010 and I see that there was a higher rate of vetos for assembly bills. It would be interesting to compare enrollment rates and veto rates of Democrat and GOP-sponsored bills introduced in the remaining years, when the legislature and governor’s mansion are held by the same party. The minority party has a harder time getting bills through committees and I would imagine that they have higher attrition.