
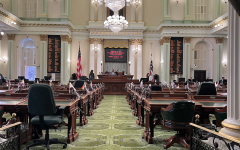
The Legislative Bill Room, California State Capitol. (Photo: ca.gov)
Disposition of California Senate Bills
There are averages for each of these figures based upon the 16-year cumulative data
By Chris Micheli, October 3, 2024 12:00 pm
Over the past sixteen years, I have tracked by each year of the 2-year California Legislative Sessions a series of actions related to bills. The following chart lists those seven actions per session year. The first figure is the number of Senate Bills introduced each year; the second figure is the number of those SBs that passed off the Senate Floor (and the percentage this figure represents of SBs introduced); the third figure is the number of SBs that were refused passage on the Senate Floor, but excluding those that were granted reconsideration; the fourth figure is the number of SBs that did not reach the Senate Floor (and the percentage this figure represents of SBs introduced); the fifth figure is the number of SBs enrolled and sent to the Governor’s Desk; the sixth figure is the number of SBs signed into law by the Governor (i.e., chaptered); and, the seventh figure is the number of SBs vetoed by the Governor. At the bottom of this chart, I include averages for each of these figures based upon the 16-year cumulative data.
| Session Year | SBs Introduced | SBs Passed by the Senate | SBs Refused Passage on Senate Floor | SBs Not Reaching Senate Floor | SBs Enrolled | SBs Chaptered | SBs Vetoed |
| 2024 | 639 | 540 / 85% | 2 | 99 / 15% | 415 | 349 | 66 |
| 2023 | 891 | 658 / 74% | 0 | 233 / 26% | 381 | 330 | 51 |
| 2022 | 672 | 605 / 90% | 6 / 1% | 61 / 9% | 442 | 381 | 61 |
| 2021 | 828 | 551 / 67% | 0 | 277 / 33% | 313 | 292 | 21 |
| 2020 | 682 | 246 / 36% | 2 | 434 / 64% | 137 | 117 | 20 |
| 2019 | 792 | 562 / 71% | 1 | 229 / 29% | 346 | 296 | 50 |
| 2018 | 694 | 518 / 75% | 3 | 173 / 25% | 408 | 356 | 52 |
| 2017 | 817 | 514 / 63% | 1 | 302 / 37% | 325 | 291 | 34 |
| 2016 | 676 | 483 / 71% | 0 | 193 / 29% | 368 | 319 + 2 w/o signature | 48 |
| 2015 | 805 | 480 / 60% | 0 | 325 / 40% | 320 | 280 | 39 |
| 2014 | 641 | 463 / 72% | 0 | 178 / 28% | 372 | 326 + 1 w/o signature | 45 |
| 2013 | 826 | 499 / 60% | 0 | 327 / 40% | 354 | 315 | 39 |
| 2012 | 632 | 472 / 74% | 5 / 1% | 155 / 25% | 356 | 309 | 47 |
| 2011 | 948 | 511 / 54% | 3 | 434 / 46% | 357 | 297 | 60 |
| 2010 | 662 | 473 / 71% | 1 | 189 / 29% | 358 | 268 | 90 |
| 2009 | 833 | 460 / 55% | 0 | 373 / 45% | 308 | 244 | 64 |
| Averages over past 16 years | 752 | 470 / 63% | 1.5 | 249 / 33% | 348 / 46% | 298 | 49 |

- Undertakings in California - March 15, 2026
- Marine Life Definitions - March 15, 2026
- An Introduction to the California Constitution - March 14, 2026
RELATED ARTICLES
-
-
 October 14, 2023
 -
 January 7, 2022