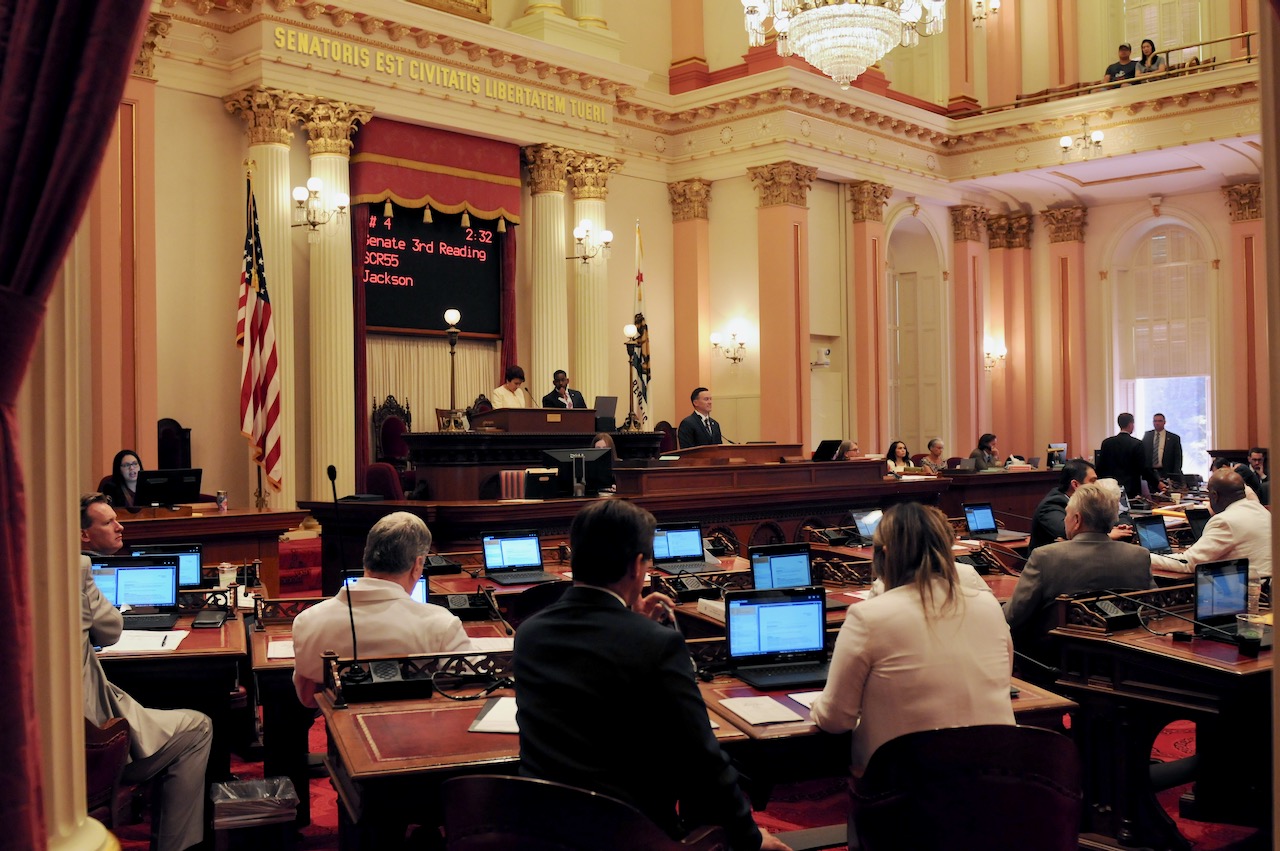
California State Assembly. (Photo: Kevin Sanders for California Globe)
Summary of California Bills Per Session and Actions Taken
An examination of the following five categories of information
By Chris Micheli, October 2, 2024 2:34 pm
The following research was updated in October 2024 in order to examine the major actions involving bills in the California Legislature over the past eighteen years. I examined the following five categories of information for each year, as set forth in the chart below:
- The number of bills introduced each year of session.
- The number of bills passed by the house of origin (e.g., ABs that passed the Assembly Floor) and the percentage of bills passed by the house of origin in comparison to the number of bills introduced.
- The number of bills refused passage by the house of origin (e.g., SBs that failed passage on the Senate Floor) and the percentage of bills that failed passed on the floor of the house of origin in comparison to the number of bills introduced.
- The number of bills that reached the Governor’s Desk and the percentage of bills that reached the Governor’s Desk in comparison to the number of bills introduced.
- The number of bills chaptered (i.e., signed into law) and the percentage of bills that were chaptered in comparison to the number of bills introduced, as well as the percentage of bills that were chaptered in comparison to the number of bills that reached the Governor’s Desk.
| Number of Bills Introduced (house and year) | Number of Bills Passed by House of Origin (and % of introduced bills) | Number of Bills Refused Passage on the Floor of the House of Origin (and % of introduced bills) | Number of Bills Reaching the Governor’s Desk (and % of introduced bills) | Number of Bills Chaptered (and % of introduced bills; and % of bills reaching Gov’s Desk) |
| Senate – 2024: 639 | 540 – 84.5% | 2 – 0.3% | 415 – 65% | 349 – 54.6% and 84% |
| Assembly – 2024: 1,520 | 936 – 61.6% | 0 – 0% | 791 – 52% | 668 – 44% and 84.4% |
| Senate – 2023: 891 | 659 – 74% | 0 – 0% | 381 – 42.7% | 330 – 37% and 86.6% |
| Assembly – 2023: 1,771 | 1,056 – 60% | 1 – 0.05% | 665 – 38% | 560 – 31.6% and 84.2% |
| Senate – 2022: 672 | 605 – 90% | 6 – 0.9% | 442 – 65.8% | 381 – 56.7% and 86.2% |
| Assembly – 2022: 1,383 | 849 – 61.4% | 9 – 0.6% | 724 – 52.3% | 616 – 44.5% and 85% |
| Senate – 2021: 828 | 551 – 66.5% | 0 – 0% | 313 – 37.8% | 292 – 35.2% and 93.3% |
| Assembly – 2021: 1,593 | 793 – 49.8% | 8 – 0.5% | 523 – 32.8% | 478 – 30% and 91.4% |
| Senate – 2020: 682 | 246 – 36% | 2 – 0.3% | 137 – 20% | 117 – 17% and 85.4% |
| Assembly – 2020: 1,541 | 430 – 27.9% | 7 – 0.4% | 291 – 18.9% | 255 – 16.5% and 87.6% |
| Senate – 2019: 792 | 562 – 70.9% | 1 – 0.1% | 346 – 43.7% | 296 – 37.4% and 85.5% |
| Assembly – 2019: 1,833 | 1,040 – 56.7% | 0 – 0% | 696 – 37.7% | 574 – 31.3% and 82.5% |
| Senate – 2018: 694 | 518 – 74.6% | 3 – 0.4% | 408 – 58.8% | 356 – 51.3% and 87.3% |
| Assembly – 2018: 1,531 | 942 – 61.5% | 16 – 1% | 809 – 52.8% | 660 – 43% and 81.6% |
| Senate – 2017: 817 | 514 – 63% | 1 – 0.1% | 325 – 39.8% | 291 – 35.6% and 89.5% |
| Assembly – 2017: 1,733 | 970 – 56% | 1 – 0.06% | 652 – 37.6% | 568 – 32.8% and 87% |
| Senate – 2016: 676 | 483 – 71.4% | 0 – 0% | 368 – 54.4% | 319 – 47.2% and 86.7% |
| Assembly – 2016: 1,366 | 846 – 62% | 19 – 1.4% | 684 – 50% | 574 – 42% and 84% |
| Senate – 2015: 805 | 480 – 59.6% | 0 – 0% | 320 – 39.7% | 280 – 34.8% and 87.5% |
| Assembly – 2015: 1,549 | 906 – 58.5% | 8 – 0.5% | 621 – 40% | 527 – 34% and 84.8% |
| Senate – 2014: 641 | 463 – 72% | 0 – 0% | 372 – 58% | 326 – 50.8% and 87.6 |
| Assembly – 2014: 1,336 | 852 – 63.8% | 6 – 0.4% | 703 – 52.6% | 605 – 45.3% and 86% |
| Senate – 2013: 826 | 499 – 60.4% | 0 – 0% | 354 – 42.8% | 315 – 38% and 89% |
| Assembly – 2013: 1,430 | 766 – 53.6% | 2 – 0.1% | 542 – 37.9% | 485 – 34% and 89.5% |
| Senate – 2012: 632 | 472 – 74.7% | 5 – 0.8% | 356 – 56.3% | 309 – 48.9% and 86.8% |
| Assembly – 2012: 1,267 | 743 – 58.6% | 12 – 0.9% | 640 – 50.5% | 567 – 44.7% and 88.6% |
| Senate – 2011: 948 | 511 – 53.9% | 3 – 0.3% | 357 – 37.6% | 297 – 31.3% and 83.2% |
| Assembly – 2011: 1,433 | 767 – 53.5% | 7 – 0.05% | 513 – 35.8% | 447 – 31.2% and 87% |
| Senate – 2010: 662 | 473 – 71.4% | 1 – 0.1% | 358 – 54% | 268 – 40.5% and 74.8% |
| Assembly – 2010: 1,209 | 759 – 62.8% | 4 – 0.3% | 671 – 55.5% | 465 – 38.5% |
| Senate – 2009: 833 | 460 – 55.2% | 0 – 0% | 308 – 37% | 244 – 29.3% and 79.2% |
| Assembly – 2009: 1,590 | 904 – 56.8% | 0 – 0% | 585 – 36.8% | 408 – 25.6% and 69.7% |
| Senate – 2008: 729 | 562 – 77% | 4 – 0.5% | 427 – 58.6% | 288 – 39.5% and 67.4% |
| Assembly – 2008: 1,333 | 879 – 66% | 6 – 0.4% | 752 – 56.4% | 477 – 35.8% and 63.4% |
| Senate – 2007: 1,052 | 584 – 55.5% | 2 – 0.2% | 380 – 36% | 299 – 28.4% and 78.7% |
| Assembly – 2007: 1,751 | 918 – 52.4% | 0 – 0% | 584 – 33.3% | 451 – 25.7% and 77.2% |
The following are some observations I make about the data set forth above:
- The second year of the 2-year session always has fewer bill introductions than the first year.
- The Assembly generally has two or more times the number of bill introductions than the Senate, which we would expect as there are twice as many Assembly Members as Senators.
- It is rare for a bill to fail passage on the floor in its house of origin, generally less than 1% chance of failing.
- Bills reaching the Governor’s Desk range from a low of 19% to a high of 65%, but the average is about 40% of those bills that were introduced make it through the entire process to reach the Governor.
- The signature rate of those bills reaching the Governor’s Desk range from about 63% to 93%, but the average is about 85% of those bills that reach the Governor are signed into law.
In the future, I anticipate either an annual update to this chart or an update after each 2-year session concludes.
Latest posts by Chris Micheli (see all)
- Interpretation of Obligations - December 15, 2024
- Sabotage Prevention Act - December 14, 2024
- Why Would the Legislature Request? - December 13, 2024


