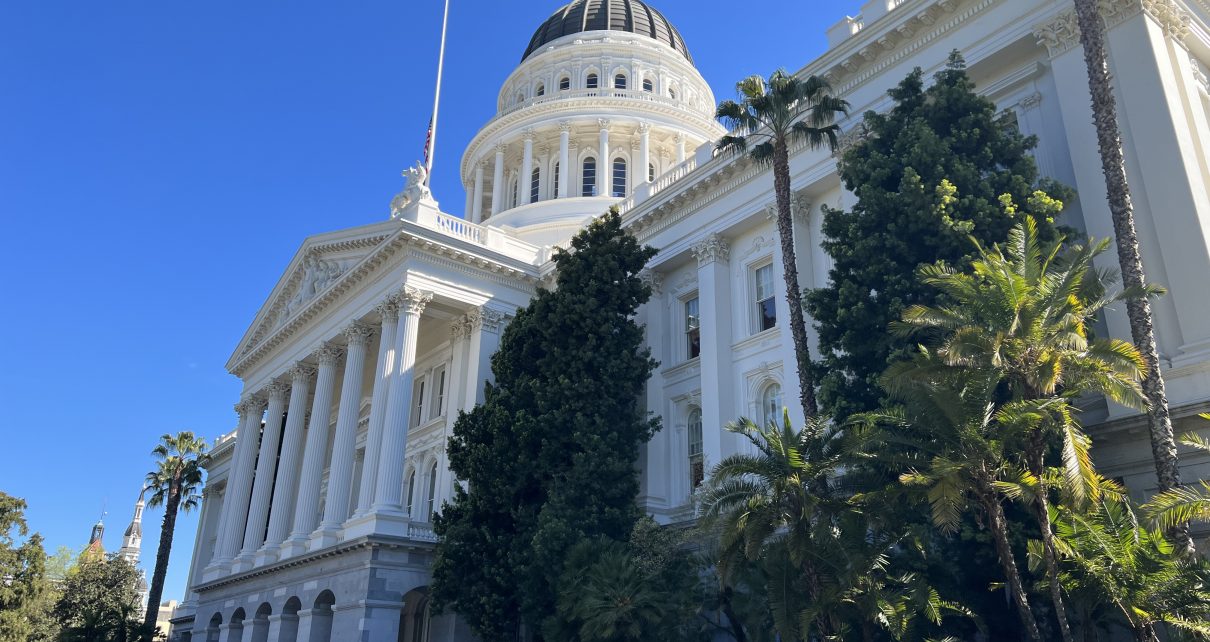
California State Capitol (Photo: Kevin Sanders for California Globe).
Additional Categories of Bills Over the Past Few Sessions
Data is compiled concerning nine additional categories of bills that can be tracked and examined
By Chris Micheli, September 24, 2024 1:00 pm
I have compiled another chart from the past sixteen years of the California Legislature and the number of bills each 2-year Session under 14 categories in comparison to the number of bills introduced that session. In the chart below, I compiled data concerning nine additional categories of bills that can be tracked and examined.
The following is the chart and per Session data:
| Session | Sunset Date | Contingent Enactment | Double-Jointed | Pilot Project | Applies to All Cities | Retroactive Effect | Public Right of Access Disclaimer | Disclaim Gift of Public Funds | Continuous Appropriation |
| 2023 – 24 | 622 | 55 | 220 | 51 | 121 | 113 | 167 | 33 | 211 |
| 2021 – 22 | 485 | 16 | 221 | 90 | 82 | 137 | 156 | 43 | 249 |
| 2019 – 20 | 422 | 10 | 140 | 75 | 74 | 171 | 129 | 18 | 235 |
| 2017 – 18 | 415 | 4 | 213 | 92 | 15 | 99 | 110 | 11 | 265 |
| 2015 – 16 | 372 | 6 | 188 | 83 | 4 | 114 | 100 | 9 | 230 |
| 2013 – 14 | 344 | 7 | 172 | 80 | 2 | 85 | 55 | 15 | 214 |
| 2011 – 12 | 401 | 7 | 154 | 77 | 19 | 109 | 21 | 3 | 202 |
| 2009 – 10 | 400 | 7 | 145 | 80 | 7 | 149 | 24 | 6 | 325 |

Chris Micheli is an attorney and lobbyist with Snodgrass & Micheli, LLC, as well as an Adjunct Professor at McGeorge School of Law.
Latest posts by Chris Micheli (see all)
- Modes of Acquiring Property - July 14, 2026
- Chart of Types of Legislative Publications - July 13, 2026
- Courts Removing Statewide Measures from the Ballot - July 13, 2026
RELATED ARTICLES
-
 September 23, 2023
 -
 September 22, 2024
 -
 September 23, 2024