California’s Financial Future Looking Shaky After 2019 Legislative Session
‘We are at debt capacity!’
By Katy Grimes, September 23, 2019 8:37 am
‘California’s unrestricted net deficit grew by 25 percent in the last year alone’
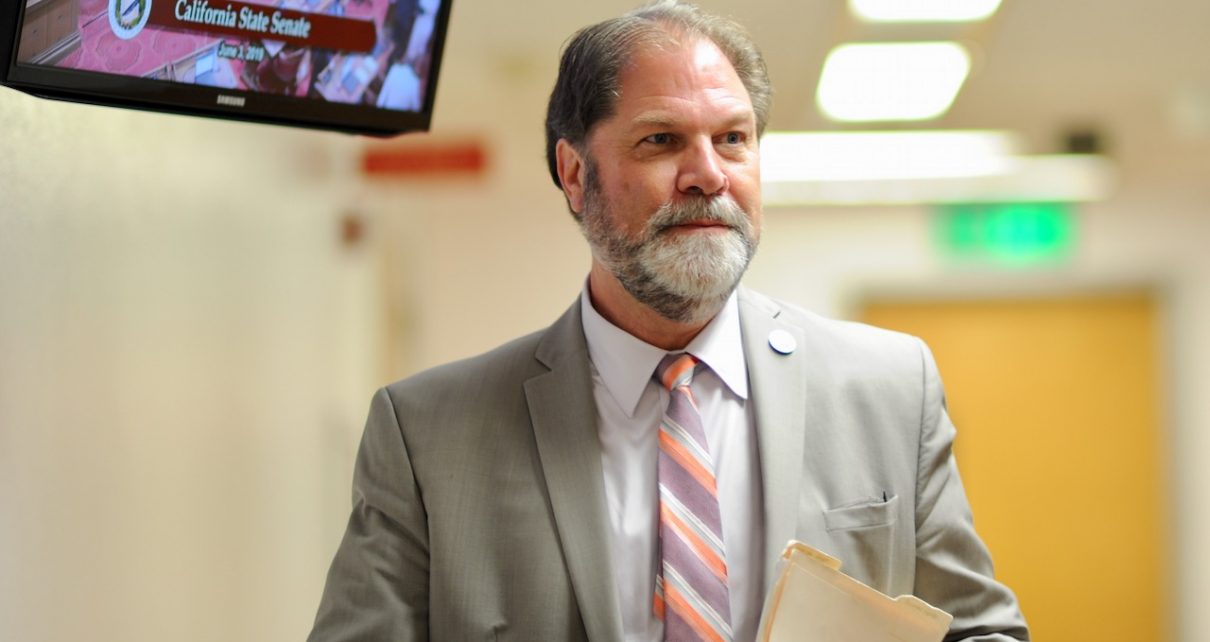
Following the close of the 2019 legislative session, Sen. John Moorlach (R-Costa Mesa) provided a listing of “California’s Dirty Baker’s Dozen: Veto-Worthy Policy Proposals that Shouldn’t Be Law.”
Many of these bills California Globe covered extensively during the year:
- AB 44 – the ban on fur
- SB 1 – the “Trump Resist” bill which would threaten California’s water supply
- AB 5 – the bill to take over and unionize the rideshare business and related gig economy
- SB 276 & SB 714 – the mandatory vaccine bills removing doctors medical exemptions, and
- AB 1482 – ignoring voters recent rejection of a statewide rent control initiative, AB 1482 imposes one anyway
Sen. Moorlach, a Certified Public Accountant by profession, regularly addresses the state’s huge and growing debt. He warns his lawmaker colleagues during committee hearings on taxing and spending bills. He warns them during Senate floor debate before voting on these bills. Yet these bad spending bills continue to be passed by a Legislature apparently unconcerned about the future financial stability of the state.
Most notably, Moorlach recently warned that California’s unrestricted net deficit grew by 25 percent in the last year alone. Moorlach explains that the unrestricted net asset (or deficit) is a summary of the state’s available assets after removing from the balance sheet fixed assets (buildings, parks, roads, etc.) minus outstanding debt obligations for these fixed assets.
Specifically, Moorlach warns about AB 48 by Assemblyman Patrick O’Donnell (D-Long Beach), which will place a $15 billion K-12 through higher education facilities bond on the March 2020 ballot. “We Are At Debt Capacity!” Moorlach said. “California’s Unrestricted Net Deficit grew by $43.8 billion in the last year alone, from $169.5 to $213.3 billion (a 25 percent increase!). If it were not for New Jersey, the Golden State would have the largest deficit of all the 50 states. California needs to improve its balance sheet before it takes on more bond debt, regardless of how noble the cause for the bond proceeds. With rising pension costs, a volatile income tax system, and a potential recession on the horizon, adding more than $700 million in new annual debt payments to the state’s general fund budget may result in additional requests for more taxes and/or significant budget cuts in future years. When California has a supposed budget surplus this year, more debt and taxes make no sense.”
Another big concern are the charter school elimination bills: AB 1505, by Assemblymembers O’Donnell, Bonta, McCarty & Smith, and co-authored by the powerful state teachers union California Teachers Association, and AB 1507, by Assemblymembers Smith, McCarty, and O’Donnell.
A powerful liaison of aggressive teacher unions and politicians supported by them produced the bills which threaten to destroy California’s wildly popular and successful charter schools, and the 630,000 school children who benefit from them. The bills would cap the number of charter schools in the state, and limit the ability of charter-school organizers to appeal anti-charter decisions by often union-controlled local school boards to county and state boards of education.
“Edging Toward Charter School Elimination: These bills effectively impose a moratorium on charter schools and limit the number and locations of resource centers that a charter school may operate, anticipating their total elimination in California,” Moorlach said. “Neither bill makes any sense to anyone, except those who wish to eliminate charter schools as competition to the incumbent monopoly of traditional public schools over a blended learning or personalized learning environment.”
Moorlach ranked California’s school districts by their cumulative unrestricted net deficit (listing below). He notes “the cumulative unrestricted net deficit for the year ended June 30, 2017 was $50.6 billion. A year later, for the year ended June 30, 2018, it is $70.8 billion. The requirement of including Other Post-Employment Benefits is the main reason the total deficit has grown by $20 billion, or 40 percent, in the last year!”
Limiting California school children’s choices will be costly in many ways, but especially in poor and minority school communities. Charter schools in California have had a very tough time because of teacher union resistance, says Lance Izumi, Director of Education Studies at the Pacific Research Institute. Izumi warned that AB 1505 will impose even higher hurdles for charter schools.
AB 1505 changes current California law, which requires proposed charter schools to have 1) financial viability, and 2) a sound academic program. The bill adds in a third criteria: the fiscal impact of the proposed charter school on the school district. If this fiscal impact is found to be negative, the school board can deny the charter school. “Given that most school districts will be able to find some type of financial impact of the proposed charter on that district, it’s going to be used to stifle any creation of charter schools throughout California,” Izumi said. “For charter schools to ‘drain’ public schools of funding, one must assume that students are the property of the regular public schools.”
“Parents and their children voluntarily choose to go to charter schools because charters often perform better, children are safer, and charters offer the type of curriculum and personalized learning that students want,” Izumi said in an interview earlier this year. And really, Izumi says the answer is easy: “School districts can keep students from leaving the regular public schools by simply doing a better job of educating them. It’s within their control.”
Yet, Izumi said charter schools really have no fiscal impact on school districts. His research concurs with Sen. Moorlach’s: the causes of school districts in fiscal distress is found in union contracts negotiated by local school boards, as well as high pension costs and retiree health care. “These are self-inflicted wounds,” Izumi says. “Using charter schools as scapegoats by districts in financial distress is factually wrong and diverts attention from the real causes, which is these actions by the school districts and the boards which approve things they cannot afford.”
Sen. Moorlach’s School Districts Ranking:
| Rank | School District | Population | Per Cap | 2017 | Chg |
| 1 | McKittrick Elementary | 177 | $48,698 | 2 | 1 |
| 2 | Spencer Valley Elementary | 484 | $13,842 | 1 | -1 |
| 3 | Maple Creek Elementary | 49 | $6,877 | 5 | 2 |
| 4 | Gorman Joint | 154 | $6,270 | 4 | 0 |
| 5 | Oro Grande Elementary | 1,170 | $5,320 | 701 | 696 |
| 6 | Ravendale-Termo Elementary | 148 | $4,566 | 8 | 2 |
| 7 | Santa Clara Elementary | 174 | $4,146 | 6 | -1 |
| 8 | Desert Center Unified | 268 | $3,054 | 11 | 3 |
| 9 | Little Shasta Elementary | 324 | $3,024 | 10 | 1 |
| 10 | Alpine County Unified | 1,120 | $2,942 | 9 | -1 |
| 11 | Baker Valley Unified | 1,031 | $2,870 | 17 | 6 |
| 12 | Bitterwater-Tully Elementary | 134 | $2,825 | 12 | 0 |
| 13 | Panoche Elementary | 135 | $2,710 | 16 | 3 |
| 14 | Cienega Union Elementary | 182 | $2,704 | 15 | 1 |
| 15 | Saucelito Elementary | 187 | $2,638 | 7 | -8 |
| 16 | Winship-Robbins | 616 | $2,056 | 32 | 16 |
| 17 | Silver Fork Elementary | 255 | $1,967 | 24 | 7 |
| 18 | Hornbrook Elementary | 695 | $1,943 | 22 | 4 |
| 19 | Mountain House Elementary | 380 | $1,914 | 26 | 7 |
| 20 | Lincoln Elementary | 218 | $1,827 | 14 | -6 |
| 21 | Mendota Unified | 13,075 | $1,796 | 29 | 8 |
| 22 | Orick Elementary | 386 | $1,652 | 21 | -1 |
| 23 | Junction Elementary | 147 | $1,551 | 28 | 5 |
| 24 | Forks of Salmon Elementary | 206 | $1,489 | 30 | 6 |
| 25 | Cucamonga Elementary | 28,817 | $1,461 | 23 | -2 |
| 26 | San Lucas Union Elementary | 414 | $1,445 | 104 | 78 |
| 27 | Lost Hills Union Elementary | 2,922 | $1,417 | 39 | 12 |
| 28 | Meridian Elementary | 666 | $1,374 | 36 | 8 |
| 29 | Blochman Union Elementary | 774 | $1,328 | 42 | 13 |
| 30 | Twin Ridges Elementary | 2,572 | $1,309 | 31 | 1 |
| 31 | Plainsburg Union Elementary | 473 | $1,280 | 20 | -11 |
| 32 | Shiloh Elementary | 798 | $1,192 | 38 | 6 |
| 33 | Camptonville Elementary | 788 | $1,188 | 33 | 0 |
| 34 | Seiad Elementary | 320 | $1,175 | 27 | -7 |
| 35 | Outside Creek Elementary | 758 | $1,091 | 50 | 15 |
| 36 | Hot Springs Elementary | 332 | $959 | 43 | 7 |
| 37 | Island Union Elementary | 1,455 | $888 | 45 | 8 |
| 38 | Blake Elementary | 180 | $879 | 44 | 6 |
| 39 | Lakeside Union Elementary | 2,542 | $860 | 41 | 2 |
| 40 | French Gulch-Whiskeytown Elem | 446 | $834 | 25 | -15 |
| 41 | Gravenstein Union Elementary | 5,710 | $825 | 37 | -4 |
| 42 | Richmond Elementary | 1,031 | $800 | 48 | 6 |
| 43 | Montecito Union Elementary | 6,529 | $785 | 46 | 3 |
| 44 | Laguna Joint Elementary | 364 | $780 | 34 | -10 |
| 45 | Richgrove Elementary | 3,413 | $737 | 60 | 15 |
| 46 | Fort Ross Elementary | 645 | $731 | 47 | 1 |
| 47 | Douglas City Elementary | 826 | $724 | 73 | 26 |
| 48 | Lagunita Elementary | 306 | $690 | 57 | 9 |
| 49 | Willow Grove Union Elementary | 289 | $666 | 51 | 2 |
| 50 | Mountain Union Elementary | 1,302 | $646 | 56 | 6 |
| 51 | Kirkwood Elementary | 299 | $613 | 40 | -11 |
| 52 | Fort Sage Unified | 2,969 | $607 | 55 | 3 |
| 53 | Laton Joint Unified | 3,958 | $501 | 49 | -4 |
| 54 | Big Creek Elementary | 472 | $499 | 58 | 4 |
| 55 | Vista del Mar Union | 527 | $492 | 19 | -36 |
| 56 | Bogus Elementary | 360 | $488 | 75 | 19 |
| 57 | Trinity Center Elementary | 421 | $481 | 78 | 21 |
| 58 | Alexander Valley Union Elementary | 915 | $475 | 53 | -5 |
| 59 | Linns Valley-Poso Flat Union | 649 | $473 | 120 | 61 |
| 60 | Mark West Union Elementary | 14,892 | $426 | 70 | 10 |
| 61 | Mupu Elementary | 1,005 | $412 | 54 | -7 |
| 62 | Montgomery Elementary | 886 | $411 | 68 | 6 |
| 63 | Belleview Elementary | 1,725 | $395 | 66 | 3 |
| 64 | Coffee Creek Elementary | 220 | $362 | 59 | -5 |
| 65 | Raisin City Elementary | 2,150 | $362 | 105 | 40 |
| 66 | Kenwood | 4,286 | $357 | 80 | 14 |
| 67 | Elkins Elementary | 273 | $354 | 74 | 7 |
| 68 | General Shafter Elementary | 1,142 | $350 | 940 | 872 |
| 69 | Gazelle Union Elementary | 292 | $329 | 79 | 10 |
| 70 | Dunsmuir Joint Union High | 2,454 | $315 | 64 | -6 |
| 71 | Dehesa Elementary | 2,374 | $301 | 289 | 218 |
| 72 | Harmony Union Elementary | 4,490 | $279 | 62 | -10 |
| 73 | Klamath River Union Elementary | 473 | $275 | 92 | 19 |
| 74 | Waukena Joint Union Elementary | 1,030 | $240 | 85 | 11 |
| 75 | Indian Diggings Elementary | 167 | $230 | 84 | 9 |
| 76 | Imperial Unified | 22,298 | $208 | 478 | 402 |
| 77 | Jefferson Elementary | 206 | $206 | 77 | 0 |
| 78 | Stone Corral Elementary | 751 | $194 | 86 | 8 |
| 79 | Happy Camp Union Elementary | 1,312 | $174 | 88 | 9 |
| 80 | Fountain Valley Elementary | 57,140 | $170 | 102 | 22 |
| 81 | Hart-Ransom Union Elementary | 4,505 | $168 | 69 | -12 |
| 82 | San Pasqual Valley Unified | 3,629 | $129 | 635 | 553 |
| 83 | Flournoy Union Elementary | 270 | $111 | 82 | -1 |
| 84 | Merced River Union Elementary | 858 | $84 | 187 | 103 |
| 85 | Indian Springs Elementary | 220 | $73 | 103 | 18 |
| 86 | Big Springs Union Elementary | 1,762 | $57 | 136 | 50 |
| 87 | North County Joint Union Elem | 3,717 | $46 | 107 | 20 |
| 88 | Kneeland Elementary | 335 | $43 | 101 | 13 |
| 89 | Monte Rio Union Elementary | 2,298 | $26 | 113 | 24 |
| 90 | Bonny Doon Union Elementary | 3,084 | $23 | 111 | 21 |
| 91 | Cuddeback Union Elementary | 898 | $14 | 83 | -8 |
| 92 | Armona Union Elementary | 6,546 | $11 | 125 | 33 |
| 93 | Kit Carson Union Elementary | 2,408 | $10 | 146 | 53 |
| 94 | Junction City Elementary | 692 | $6 | 97 | 3 |
| Rank | School District | Population | Per Cap | 2017 | Chg |
| 95 | Pacific Elementary | 877 | $3 | 278 | 183 |
| 96 | Lassen View Union Elementary | 2,845 | ($7) | 124 | 28 |
| 97 | McCloud Union Elementary | 1,321 | ($11) | 138 | 41 |
| 98 | Paradise Elementary | 947 | ($12) | 94 | -4 |
| 99 | Caliente Union Elementary | 973 | ($16) | 96 | -3 |
| 100 | Happy Valley Elementary | 1,480 | ($17) | 134 | 34 |
| 101 | Palo Verde Union Elementary | 2,835 | ($18) | 117 | 16 |
| 102 | Winton | 11,013 | ($18) | 160 | 58 |
| 103 | Summerville Union High | 9,905 | ($20) | 109 | 6 |
| 104 | Lucerne Elementary | 3,395 | ($23) | 123 | 19 |
| 105 | Garfield Elementary | 331 | ($25) | 76 | -29 |
| 106 | Chicago Park Elementary | 1,217 | ($25) | 163 | 57 |
| 107 | Alta-Dutch Flat Union Elementary | 1,979 | ($36) | 112 | 5 |
| 108 | Bridgeville Elementary | 560 | ($42) | 131 | 23 |
| 109 | Santa Ynez Valley Union High | 22,222 | ($47) | 133 | 24 |
| 110 | Whitmore Union Elementary | 737 | ($50) | 129 | 19 |
| 111 | Fieldbrook Elementary | 874 | ($53) | 121 | 10 |
| 112 | El Nido Elementary | 1,793 | ($68) | 144 | 32 |
| 113 | Three Rivers Union Elementary | 2,383 | ($71) | 118 | 5 |
| 114 | Burnt Ranch Elementary | 741 | ($72) | 201 | 87 |
| 115 | Somis Union | 3,279 | ($75) | 122 | 7 |
| 116 | Death Valley Unified | 744 | ($77) | 145 | 29 |
| 117 | Round Valley Joint Elementary | 1,051 | ($79) | 100 | -17 |
| 118 | Raymond-Knowles Union Elem | 1,305 | ($80) | 143 | 25 |
| 119 | Wasco Union High | 31,840 | ($83) | 99 | -20 |
| 120 | Wasco Union Elementary | 27,978 | ($88) | 295 | 175 |
| 121 | Strathmore Union Elementary | 5,866 | ($91) | 110 | -11 |
| 122 | Peninsula Union | 480 | ($91) | 161 | 39 |
| 123 | Liberty Elementary | 1,978 | ($92) | 194 | 71 |
| 124 | Warner Unified | 2,481 | ($92) | 172 | 48 |
| 125 | Chowchilla Elementary | 22,780 | ($93) | 132 | 7 |
| 126 | Browns Elementary | 976 | ($102) | 91 | -35 |
| 127 | Knights Ferry Elementary | 648 | ($106) | 155 | 28 |
| 128 | Southern Trinity Joint Unified | 1,005 | ($114) | 230 | 102 |
| 129 | Oak Run Elementary | 609 | ($117) | 114 | -15 |
| 130 | Shaffer Union Elementary | 9,317 | ($118) | 140 | 10 |
| 131 | Jamestown Elementary | 8,863 | ($119) | 149 | 18 |
| 132 | Igo, Ono, Platina Union Elementary | 1,025 | ($122) | 271 | 139 |
| 133 | Big Lagoon Union Elementary | 462 | ($126) | 127 | -6 |
| 134 | Lassen Union High | 25,153 | ($130) | 147 | 13 |
| 135 | Pleasant Valley Joint Union Elem | 923 | ($132) | 261 | 126 |
| 136 | South San Francisco Unified | 83,655 | ($138) | 81 | -55 |
| 137 | Manchester Union Elementary | 639 | ($143) | 176 | 39 |
| 138 | Kashia Elementary | 81 | ($145) | 292 | 154 |
| 139 | Tres Pinos Union Elementary | 834 | ($151) | 158 | 19 |
| 140 | Oak View Union Elementary | 3,079 | ($153) | 208 | 68 |
| 141 | Foresthill Union Elementary | 6,709 | ($155) | 142 | 1 |
| 142 | Nevada City Elementary | 15,578 | ($160) | 157 | 15 |
| 143 | Sierra-Plumas Joint Unified | 3,599 | ($160) | 152 | 9 |
| 144 | Twain Harte | 5,513 | ($163) | 98 | -46 |
| 145 | Pond Union Elementary | 737 | ($166) | 52 | -93 |
| 146 | Columbia Union | 6,069 | ($181) | 170 | 24 |
| 147 | Di Giorgio Elementary | 976 | ($186) | 90 | -57 |
| 148 | Cinnabar Elementary | 2,699 | ($187) | 139 | -9 |
| 149 | Reeds Creek Elementary | 1,291 | ($189) | 232 | 83 |
| 150 | Green Point Elementary | 234 | ($195) | 106 | -44 |
| 151 | Campbell Union High | 239,748 | ($196) | 164 | 13 |
| 152 | Big Pine Unified | 1,808 | ($197) | 108 | -44 |
| 153 | Sonora Union High | 39,113 | ($199) | 168 | 15 |
| 154 | Rockford Elementary | 1,356 | ($203) | 95 | -59 |
| 155 | Yreka Union High | 17,369 | ($209) | 181 | 26 |
| 156 | Junction Elementary | 3,750 | ($216) | 219 | 63 |
| 157 | Susanville Elementary | 10,390 | ($219) | 135 | -22 |
| 158 | Wheatland | 7,707 | ($224) | 67 | -91 |
| 159 | Columbine Elementary | 275 | ($225) | 224 | 65 |
| 160 | Atwater Elementary | 36,162 | ($225) | 159 | -1 |
| 161 | Laguna Beach Unified | 29,473 | ($233) | 180 | 19 |
| 162 | Penn Valley Union Elementary | 13,030 | ($234) | 184 | 22 |
| 163 | Sonora Elementary | 8,719 | ($235) | 167 | 4 |
| 164 | Curtis Creek Elementary | 8,974 | ($242) | 166 | 2 |
| 165 | Shasta Union Elementary | 2,308 | ($247) | 272 | 107 |
| 166 | Big Sur Unified | 467 | ($248) | 119 | -47 |
| 167 | Cutten Elementary | 5,311 | ($249) | 130 | -37 |
| 168 | Black Butte Union Elementary | 4,433 | ($249) | 367 | 199 |
| 169 | Montague Elementary | 1,955 | ($250) | 304 | 135 |
| 170 | Lakeside Joint | 2,733 | ($252) | 223 | 53 |
| 171 | Latrobe | 2,767 | ($256) | 197 | 26 |
| 172 | Evergreen Union | 9,440 | ($257) | 174 | 2 |
| 173 | Golden Feather Union Elementary | 2,787 | ($258) | 126 | -47 |
| 174 | Siskiyou Union High | 15,823 | ($258) | 236 | 62 |
| 175 | Anderson Union High | 38,951 | ($262) | 154 | -21 |
| 176 | Pine Ridge Elementary | 906 | ($263) | 89 | -87 |
| 177 | Arcohe Union Elementary | 4,980 | ($265) | 175 | -2 |
| 178 | Fremont Union High | 243,263 | ($266) | 191 | 13 |
| 179 | Sequoia Union Elementary | 2,185 | ($267) | 148 | -31 |
| 180 | Valley Home Joint Elementary | 1,776 | ($274) | 186 | 6 |
| 181 | Pleasant Grove Joint Union | 908 | ($280) | 213 | 32 |
| 182 | Sausalito Marin City | 11,035 | ($280) | 182 | 0 |
| 183 | San Antonio Union Elementary | 1,941 | ($288) | 246 | 63 |
| 184 | Modoc Joint Unified | 5,983 | ($289) | 116 | -68 |
| 185 | Nevada Joint Union High | 83,537 | ($289) | 204 | 19 |
| 186 | Fortuna Elementary | 13,711 | ($289) | 195 | 9 |
| 187 | Chowchilla Union High | 24,639 | ($292) | 190 | 3 |
| 188 | Butteville Union Elementary | 1,704 | ($294) | 240 | 52 |
For Sen. Moorlach’s last year’s full study on California’s educational fiscal rankings: https://moorlach.cssrc.us/sites/default/files/181002_CASchoolCAFRReport.pdf.

- NEW REPORT: California Ranks Among Bottom of 50 States for Financial Transparency - April 23, 2024
- President Biden Set to Sign ‘Pandemic Treaty’ with World Health Organization - April 23, 2024
- Gov. Newsom Claims on MSNBC Donald Trump Will Sign National Abortion Ban if Elected President - April 22, 2024
RELATED ARTICLES
-
 May 14, 2020
 -
 January 6, 2020
 -
 February 5, 2020