
Sacramento County Sheriff's Department. (Photo: saccounty.net)
California’s Most Dangerous Cities
Crime has increased in the Golden State since Prop. 47 in 2014 and Prop. 57 in 2016
By Katy Grimes, June 21, 2021 4:39 pm
Violent crimes and property crime in California is above the national average and continues to climb according to the FBI. Few California cities have been spared the ongoing impacts of rising crime.
Most interesting is the FBI graph below showing how crime in California had dropped, then began to rise again after 2014 – the year Proposition 47 was passed, and then Proposition 57 in 2016.
Proposition 47 largely decriminalized theft and drug crimes by reducing those crimes and a number of other “non-violent” felonies to misdemeanors; Prop. 57 allows early release for “non-violent offenders,” including rape by intoxication of an unconscious person, human trafficking involving a sex act with minors, arson causing great bodily harm, drive-by shooting, assault with a deadly weapon, and hostage taking.
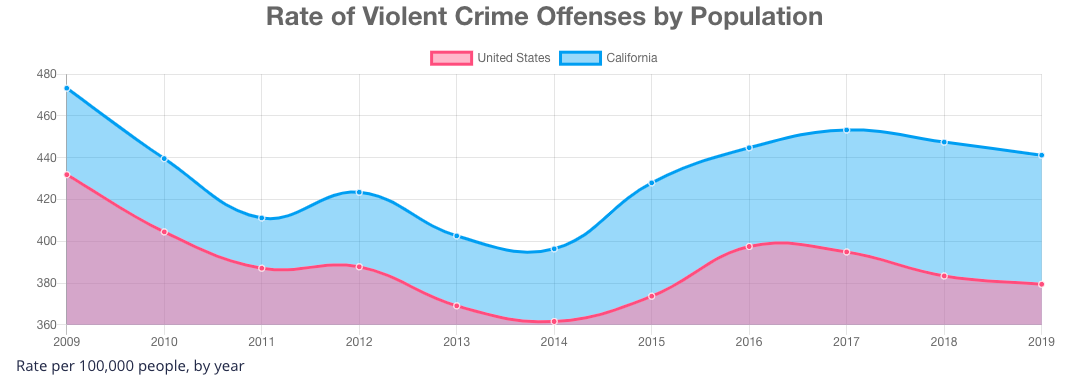
The FBI collects these data through the Uniform Crime Reporting (UCR) Program. The data are collected via the Summary Reporting System (SRS). For agencies reporting via the National Incident-Based Reporting System, the submissions are converted to SRS data to be consistent for this presentation. Violent crime includes the offenses of murder and non-negligent manslaughter, rape (revised definition), robbery, and aggravated assault. Property crime includes the offenses of burglary, larceny-theft, and motor vehicle theft.
Curiously, the FBI reports that in 2019, California did not contribute to the National Incident-Based Reporting System (NIBRS) data collection. The FBI reports, “in 2019, the FBI estimated crime statistics for the nation are based on data received from 738 of 743 law enforcement agencies in the country that year.”
According to a January 2021 report by Roadsnacks.net, California’s crime numbers have also catapulted the state into the top 20 most dangerous states in America; and sadly, the state is home to nine-—yes, nine—of the most dangerous cities in the country.
To compile the list, Roadsnacks.net says they looked at FBI data for violent crimes and property crimes in California cities with a population of 5,000, which totaled 415 cities. “We discovered that the cities that made our list have robberies happening in broad daylight, carjackings, and daily shootings,” they said. “There are neighborhoods in these cities that you shouldn’t drive through, ever, and there are areas that you definitely shouldn’t be in after dark.”
Roadsnacks.net listed The Most Dangerous Cities In California For 2021, and explained why:
- Emeryville – the most property crimes in the state.
- Oakland– an overall crime rate 150% higher than the national average, a murder happening every five days on average.
- Commerce – Over the course of a year, any given resident has a 1 in 12 chance of being the victim of a property crime, the second highest rate in California.
- Red Bluff experienced a shocking rate of violent crime in 2019.
- Signal Hill – surrounded entirely by Long Beach, Roadsnacks.net says Signal Hill comes in as the fifth most dangerous place to call home in California.
- San Bernardino – With 46 murders in 2019, San Bernardino had the third highest murder rate in the state for 2019.
- West Hollywood – West Hollywood’s property crime rate is the ninth highest in the state, and rape cases are the 39th highest.
- Stockton had the third highest violent crime rate in California, with 34 murders, 181 rapes, and 3,007 aggravated assaults.
- Marysville Marysville actually had about twice as many car thefts per capita as Stockton.
- Barstow – Burglary is especially prevalent in Barstow and ranks as the fourth highest rate in California. Barstow’s violent crime rate as a whole is also in the top ten statewide.
Gold Country Media reviewed the FBI data and reported that the statistics reveal Placer County communities are among the safest in state.
Gold Country Media reported in the Capitol region, “While Elk Grove follows Folsom’s lead with a strong 125, the city of Sacramento comes in at a dismal 383. That’s among the top 40 worst crime cities. Just across the river in West Sacramento, crime is slightly lighter than the Capital at number 347.”
Roadsnacks.net reported:
Sacramento is #33 out of 415:
- Population: 513,934
- Violent Crime Per Capita: 627
- Property Crime Per Capita: 3,182
The nearby town of Woodland ranked #105 out of 415.
- Population: 61,176
- Violent Crime Per Capita: 366
- Property Crime Per Capita: 2,432
- Population: 47,735
- Violent Crime Per Capita: 402
- Property Crime Per Capita: 3,640
- Population: 153,215
- Violent Crime Per Capita: 349
- Property Crime Per Capita: 1,548
- Population: 84,577
- Violent Crime Per Capita: 112
- Property Crime Per Capita: 1,053
- Population: 141,744
- Violent Crime Per Capita: 182
- Property Crime Per Capita: 2,225
You can locate your city here; just scroll down to the bottom and type in the name of your city.
ca dangerous cities
A California native and Navy mom, Katy lives in Sacramento, CA.
- California Economy Up 3.7%, Just Below Washington State +4.5% - July 17, 2026
- Solano County’s ‘California Forever’ Project Loses $3.2 Billion Shipyard to Texas - July 17, 2026
- California Suing Calexico, Costa Mesa, Half Moon Bay, Ridgecrest, and Turlock Over State ‘Affordable’ Housing Law - July 16, 2026
RELATED ARTICLES
-
 May 18, 2019
 -
-
 April 25, 2019
The passage of the propositions was part of a bigger plan. The “culture of leniency” started to take off in 2013-2014, during the second Obama term with the “sanctuary” movement. Not only did the sanctuary city/state laws encourage homeless migration to California, the laws also provided cover to leftist organizers who established the enclaves and the paid advocate groups to support them. WE let this happen. This is what law enforcement must now deal with on a daily basis: https://www.dailywire.com/news/l-a-sheriff-says-paid-activists-are-behind-opposition-to-cleaning-up-homeless-encampments
It predates then and – like so many other problems we’re now facing – first surfaced in SF in the ’60s.
Great article, Katy, but I’d sure like to see some demographics on who the culprits and victims are.
This list is screwy. We are supposed to believe Big Bear has the most violent crime?
Yeah, I agree Chico. That seems wrong. How can Big Bear up in the San Bernardino mountains rank No. 1 in violent crime? Big Bear, Lake Arrowhead area is pretty exclusive high rent; unless it changed a lot since I visited there.
The method of ranking based on per capita crimes (population/crimes) distorts the data. Small towns are penalized more and larger cities less. The ranking should be done by total number of crimes instead of per capita.
They used towns/cities with 5,000 or more residents. Anything below 5,000 was not counted or used.
The issue is how they calculated the rankings.
This killing in Chicago reminds me of the Kathryn Steinle shooting in San Francisco: https://www.foxnews.com/us/chicago-stabbing-maryland-graduate-student-homeless-man. Apparently, MORE people MUST be killed before the electorate and the representatives they send to our legislatures decide to ACT. We KNOW where the crime is happening.
As I said, we KNOW where the crimes are occurring: https://www.foxnews.com/us/california-cop-killed-responding-to-domestic-disturbance. BACK THE BLUE.
Hesperia where does it rank
Large Democrat ran cities is where the crime is going on and don’t forget criminals travel to smaller cities and wealthier areas to do their crimes