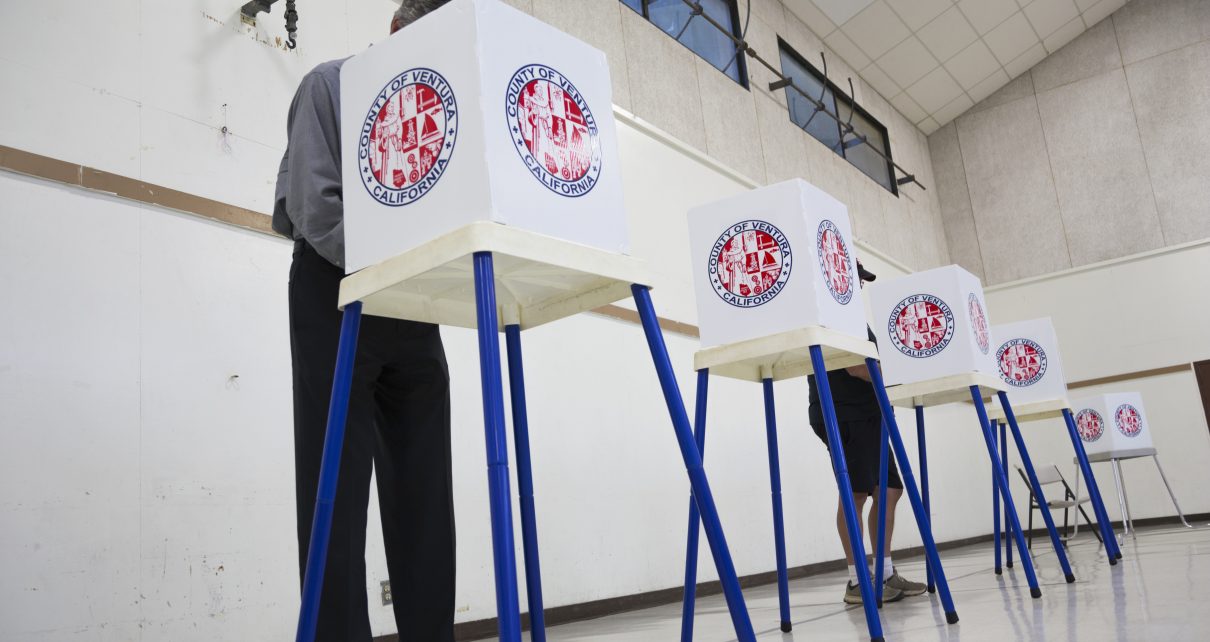
Election booth polling station in gymnasium, Oak View, CA Nov. 4, 2014. (Photo: Joseph Sohm/Shutterstock)
2022 California Primary Election Results
California Globe has results of all major and contended races in California
By Katy Grimes and Evan Symon, June 7, 2022 9:13 pm
Tuesday June 7, 2022 is California’s Primary Election Day. We are reporting and updating as results come in. The results we see early are the early voting and mail-in ballots tabulated on Election night. And, with the all mail in ballot election, the votes are counted for the entire month following Election Day. So some of the really close races could change in the next 30 days.
Remember, in California’s top-two system, also known as a “Jungle Primary,” voters choose from a slate of candidates from all parties in the primaries. The top two candidates with the most votes, regardless of which party they belong to, face off in the fall election. In California with its Democratic Supermajority, this is often the top two Democrats.
With partial results in, the California Secretary of State is reporting at 9:15pm, and updated at 3:58am:
San Francisco District Attorney Chesa Boudin Recall
Yes – 74,335 – 60%
No – 49,591 – 40%
State
U.S. Senate – Open Primary
Alex Padilla (D) – 1,702,913 – 55%
Mark Meuser (R) – 425,943- 13.8%
U.S. Senate – Special General
Alex Padilla (D) – 1,708,755 – 55.8%
Mark Meuser (R) – 632,012 – 20.6%
Governor
Gavin Newsom (D) – 1,907,392 – 56.6%
Brian Dahle (R) – 563,543 – 16.7%
Jenny Le Roux (R) – 122,925 – 3.6%
Michael Shellenberger (I) – 123,641 – 3.7%
Anthony Trimino (R) – 104,324 – 3.1%
Attorney General
Rob Bonta (D) – 1,813,034 – 54.8%
Eric Early (R) – 548,885 – 16.6%
Nathan Hochman (R) – 606,885 – 18.3%
Controller
Malia M. Cohen (D) – 577,140 – 26.6%
Lanhee Chen (R) – 841,737 – 33%
Secretary of State
Shirley Weber (D) – 1,472,476 – 63.3%
Rob Bernosky (R) – 430,833 – 18.5%
Treasurer
Fiona Ma (D) – 1,609,569 – 61.8%
Andrew Do (R) – 441,813 – 17%
Insurance Commissioner
Ricardo Lara (D) – 1,024,621 – 39.7%
Marc Levine (D) – 471,490 – 18.3%
Superintendent of Public Instruction
Tony K. Thurmond – 1,181,920 – 48.9%
Ainye E. Long – 285,852 – 11.8%
Congressional
3rd District
Kevin Kiley (R) – 32,665 – 36.5%
Scott Jones (R) – 15,212 – 17%
Kermit Jones (D) 35,253 – 39.4%
9th District
Josh Harder (D) – 7,336 – 36.5%
Tom Patti (R) – 5,816 – 28.9%
13th District
Adam Gray (D) – 11,029 – 33.2%
Phil Arballo (D) – 6,339 – 19.1%
John Duarte (R) – 10,232 – 30.8%
22nd District
David Valadao (R) – 4,217 – 25.4%
Rudy Salas (D) – 8,437 – 50.9%
Chris Mathys (R) – 2,850 – 17.2%
27th District
Mike Garcia (R) – 33,653 – 49.6%
Christy Smith (D) – 24,007 – 35.4%
Quaye Quartey (D) – 4,037 – 5.9%
40th District
Young Kim (R) – 30.899 – 34.3%
Greg Raths (R) – 22,127 – 24.5%
Asif Mahmood (D) – 35,893 – 39.8%
45th District
Michelle Steel (R) – 34,667 – 49.3%
Jay Chen (D) – 28,935 – 41.2%
47th District
Katie Porter (D) – 44,528 – 51%
Scott Baugh (R) – 26,923 – 30.8%
49th District
Mike Levin (D) – 52,118 – 54.6%
Brian Maryott (R) – 16,579 – 17.4%
Lisa Bartlett (R) – 9,472 – 9.9%
Assembly
12th District
Sarah Aminzadeh (D) – 16,319 – 35.4%
Damon Connoly (D) – 17,807 – 38.6%
Steve Schwartz (D) – 7,006 – 15.2%
20th District
Liz Ortega (D) – 8,297 – 31.1%
Joseph Grcar (R) – 6,179 – 23.1%
Shawn Kumagai (D) – 6,685 – 25%
21st District
Gisele Hale (D) – 5,847 – 16.6%
Diane Papan (D) – 16,071 – 45.6%
Mark Gilham (R) – 7,217 – 20.5%
22nd District
Jess Self (D) – 7,163 – 28.9%
Chad Condit (D) – 6,363 – 25.7%
Juan Alanis (R) – 7,727 – 31.2%
24th District
Alex Lee (D) – 12,051 – 39.9%
Kansen Chu (D) – 5,474 – 18.1%
Bob Brunton (R) – 6,592 – 21.8%
27th District
Esmerelda Soria (D) – 10,473 – 42%
Mark Pazin (R) – 8,281 – 33.2%
34th District
Tom Lackey (R) – 8,765 – 28.1%
Thurston Smith (R) – 8,127 – 26.1%
Rita Ramirez Dean (D) – 10,152 – 32.6%
40th District
Suzette Valladares (R) – 19,012 – 44.8%
Pilar Schiavo (D) – 14,021 – 33%
Annie Cho (D) – 9,397 – 22.1%
70th District
Tri Ta (R) – 9,175 – 22.2%
Kimberly Ho (R) – 5,735 – 13.9%
Ted Bui (R) – 5,742 – 13.9%
Diedre Nguyen (D) – 15,883 – 38.5%
76th District
Brian Maienschein (D) – 30,707 – 50.3%
Kristie Bruce-Lane (R) – 16,689 – 27.4%
June Cutter (R) – 3,592 – 22.3%
State Senate
District 2
Mike McGuire (D) – 64,343 – 78.3%
Gene Yoon (R) – 17,878 – 21.7%
District 4
Tim Robertson (D) – 25,647 – 24.4%
Marie Alvarado-Gil (D) – 21,871 – 20.8%
District 6
Paula Villescaz (D) – 35,574 – 50.5%
Roger Niello (R) – 26,651 – 37.8%
District 8
Dave Jones (D) – 20,301 – 46.4%
Angelique Ashby (D) – 18,370 – 42%
District 10
Lily Mei (D) – 20,929 – 36.8%
Aisha Wahab (D) – 14,491 – 25.5%
District 12
Shannon Grove (R) – 36,443 – 60.6%
Susanne Gundy (D) – 23,683 – 39.4%
District 14
Anna Caballero (D) – 24,004 – 57.4%
Amnon Shor (R) – 14,763 – 35.3%
District 16
David Shepard (R) – 9,164 – 38.1%
Melissa Hurtado (D) – 8,294 – 34.5%
District 18
Steve Padilla (D) – 38,848 – 63.6%
Alejandro Galicia (R) – 22,196 – 36.4%
District 20
Daniel Hertzberg (D) – 14,540 – 35%
Caroline Menjivar (D) – 10,949 – 26.4%
District 22
Susan Rubio (D) – 25,533 – 64.7%
Vincent Tsai (R) – 9,940 – 25.2%
District 24
Ben Allen (D) – 68,862 – 100% (ran unopposed)
District 26
Maria Elena Durazo (D) – 38,945 – 100% (ran unopposed)
District 28
Lola Smallwood-Cuevas (D) – 21,115 – 40.8%
Cheryl C. Turner (D) – 16,750 – 32.4%
District 30
Bob Archuleta (D) – 18,914 – 40.6%
Mitch Clemmons (R) – 13,800 – 29.6%
District 32
Kelly Seyarto (R) – 38,388 – 55.2%
Brian Nash (D) – 31,201 – 44.8%
District 34
Tom Umberg (D) – 23,526 – 61.6%
Rhonda Shader (R) – 14,654 – 38.4%
District 36
Janet Nguyen (R) – 46,584 – 50.7%
Kim Carr (D) – 45,348- 49.3%
District 38
Catherine Blakespear (D) – 56,496 – 47.7%
Matt Gunderson (R) – 48,401 – 40.9%
District 40
Brian W. Jones (R) – 60,430 – 51.5%
Joseph C. Rocha (D) – 56,828 – 48.5%
Local
Los Angeles Mayor
Rick Caruso (D) – 133,059 – 42.1%
Karen Bass (D) – 116,688 – 37%
Kevin de Leon (D) – 23,655 – 7.5%
The Globe will update as more results are officially recorded and posted.

- TRUMP Wins: Election 2024 Results and Commentary - November 5, 2024
- Governor’s Office Gets Snarky With the Globe Over 10,000 Fast Food Jobs Lost - June 10, 2024
- U.S. Border Patrol Drops 1,071 Asylum Seekers in San Diego Days Before Christmas - December 28, 2022
RELATED ARTICLES
-
-
 November 4, 2020
 -
 January 18, 2022
Thank you , Evan Symon and california globe, for always keeping us informed as soon as possible.
I want to address a trend that I notice in the contributions to this election cycle.
The remarkable desire of so many “employees of ” that are choosing to make a contribution
Through their employer , despite being in a notoriously low wage job.
Employees of doordash , for example.
Jeez, we are not THAT stupid.
Looks like Chesa Boudin was wrong about crime not really being an issue in SF.
Listen to the main stream media calling crime a perceived issue.
How do we get rid of the “jungle primary” Schwarzenegger left us with???
And I’m sorta surprised at Michael Shellenberger’s low numbers. I really thought he’d appeal to more Dems than Repubs, with his “Cal-Psych” plan. Maybe Democrats aren’t really that concerned and caring about mental illness and homelessness after all.
I voted for shellnberger. Almost everyone I know did. I’m surprised very much he got less than 4%. He had great policies and ideas. Shame.
I can’t believe how dumb the voters are in this state. “Yes, we want more crime, higher taxes, higher gas prices, more inflation, more addicted homeless people on the streets, more criminals let out of jail to prey on people, a useless bullet train, higher electricity costs, more blackouts, poorer performing schools, more water shortages, high unemployment…so let’s vote Newsom and the Democrats back in office.”
Agreed! As a life long middle aged resident of this hell hole of a state politicians have foisted upon us, I continue to marvel at the stupidity of those who take the time to vote. All I can guess is that they have been bought and paid for by said idiotic politicians with our tax dollars, the few of us left still making and not taking. Perhaps we should reconsider allowing those on the dole to cast a vote as certainly there is some conflict of interest.
Are we REALLY surrounded by so many ill-informed voters??? I also find this hard to fathom, under the tyrannical mandates that we’ve suffered under and the unmitigated disaster that has existed in this state since Newsom’s failed recall election…
Yep. It took me a week or more to fill out my ballot, I had to research all the people before deciding. I seriously doubt anyone else took the time. Feels like I wasted my time, u know the voters just voted for the name they recognized. And I thought mail in ballots were unconstitutional? A judge ruled that in 2020. Yet we all got mail in ballots. Sick of this corruption, I’m done.
Maybe it’s the counters, and not the voters, who have done this again…know’m sayin’?
Is it odd or is it my imagination that the margins of victory for the Democrats in leadership are similar to the margins of the recall?
Change the voting laws, if California has any chance of becoming purple ever again!
Thanks, CA Globe, for reporting this and keeping us up to date.
There are disappointments here, but we’ve got more than four months to push ahead and work on behalf of some (still viable) candidates that we want to represent us.
No reflection on the Globe which is just reporting what they are told but this article would be better titled — Fake News of the Day. Does anyone really believe Noisome is actually wanted by 56% of Californians?
It’s all comes down to how well funded your campaign to get the word out and get known, and that takes a lot of $$$ – Larry Elder said $1M is not even close. And who is going to come up with the amount needed for an election that’s already been gamed in favor of the Dems through legal mail-in ballots and ballot harvesting? Newsom’s campaign knows to pick the loser they can beat, Dahle (R), and then market him in their ads. As for all the other unfunded unknowns running, Dem voters aren’t very smart or well informed, they just vote for those with a “(D)” by their name.
Yup, we got “Dominoned” AGAIN….
I’m not voting anymore. It’s pointless. Pretty obvious people voted for those whose names they recognize and that’s it. Can’t compete with idiocracy, cali deserves what they get at this point.
This was another fraudulent and fake, stolen election. I have seen the results firsthand. Newsom lost the recall in 33 out of 36 precincts and that’s in a highly democratic tech oriented county. We know they rigged it (again). Sharpies and election machines combined with mail in ballots and harvesting the manufactured votes they “need” is how the do it (again and again). I’m leaving this state but would love to see more patriots become involved in this fight for our democracy. Paper only, one day of voting, no mail in ballots unless for sick or disabled, QVC codes and watermarks on every serial numbered ballot, etc. This can be done and must be.