Diablo Canyon Nuclear Power Plant. (Photo: Wikipedia)
The Failure of California Electricity Policy in One Image
Veteran energy watchers know that a time-graph of electricity consumption on an electrical grid tells a story
By Carl Wurtz, April 2, 2022 7:50 am
In a few weeks it will be one year since the article “California just hit 95% renewable energy. Will other states come along for the ride?” appeared in the Los Angeles Times. Its author, reporter Sammy Roth, had learned that California briefly generated 95% of the electricity consumers were using from renewable sources a few days earlier, and he was elated. Either he believed, or he wanted us to believe, that it was only a matter of generating 5% more of our energy from wind turbines and solar panels and California would cease emitting greenhouse gases into the atmosphere. We would achieve something no other country, city, or community worldwide had achieved before.
Like the rings of a tree, veteran energy watchers know that a time-graph of electricity consumption on an electrical grid tells a story. All of its curved lines, from one moment to the next, are interrelated – when one goes down, it might cause another to go down; two others might appear to be linked – but every shape has a part to play. Though I knew Sammy’s claim wasn’t true, I had to know why it wasn’t it true – why it couldn’t have happened, even for four seconds.
I started by downloading graphs of what happened on April 24, 2021 – precise figures for supply (generation) and demand (consumption), available at the website of the California Independent System Operator (CAISO). As you’ll see, it didn’t require much investigation before the monument to solar and wind energy Roth had erected would start to crumble.
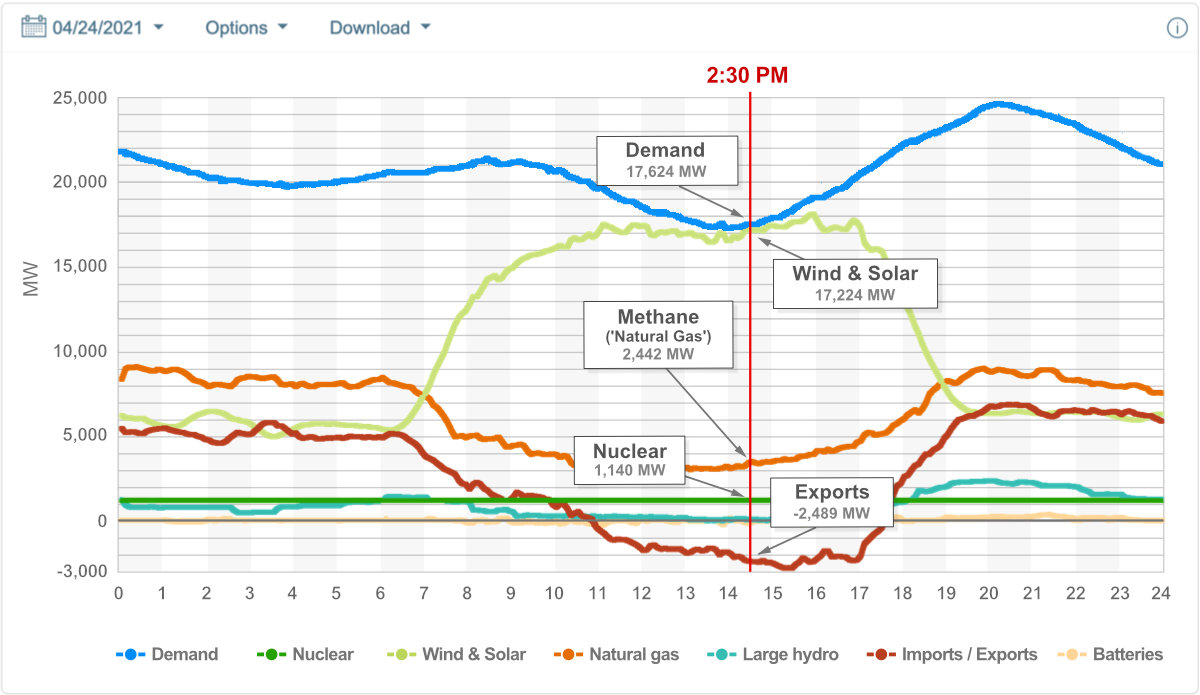
The graph below was cobbled together from several others. Some explanation:
- Time moves from left to right. The left side corresponds to 12:00 AM on April 24, the right corresponds to 12:00 AM the next morning.
- The blue line at the top shows electrical demand, measured in megawatts (MW) – the amount of power California consumers were using at each moment of the 24-hour day.
- The other lines below it show supply – how CAISO is meeting demand (at any time, the heights of all the other lines combined is equal to the height of the blue one).
- For four seconds at about 2:30 PM (red vertical line), California solar and wind generated 94% as much electricity as customers were consuming.
- At the same moment, however, natural gas plants were generating 3,442 MW and Diablo Canyon Power Plant was generating 1,144 MW – together with renewables, there was too much supply.
- If supply doesn’t precisely match demand on an electric grid, it can cause a system-wide outage. Thus California had to to export 2,489 MW to keep the grid from going down (dark red line).
- Because Arizona, Nevada, and Oregon didn’t need or want our electricity, we had to pay them to take it (euphemistically labeled “negative pricing”). It’s an expense borne by California electricity customers.
- During peak consumption (8 PM), wind and hydro are the only significant renewable resources available. Solar is providing no electricity at all.
- At that time, when electricity is most expensive, California is forced to import more than 1/4 of its electricity from other states.
Q: Why are natural gas plants running at all, if there’s too much renewable electricity?
A: Because solar and wind are unpredictable, fast-starting gas turbines must operate in “spinning reserve” to smooth their output. If a cloud covers the sun over a solar farm gas turbines must ramp up to fill in the gap in generation. Or, if the wind suddenly picks up at a large wind farm, they must ramp down to prevent overloading the grid.
Q: Then we can’t just power the grid with solar and wind?
A: That’s correct. Powering a grid with either requires natural gas to be at the ready, to smooth out any abrupt changes that may occur.
Q: Why does solar energy flatten out in the middle of the day, when the sun is high in the sky?
A: Because solar would produce too much electricity at mid-day, system operators are forced to curtail solar – to request operators shut their farms down. And solar farms are paid to turn off their output – another expense borne by California electricity customers for which they receive nothing of value.
Q: So, having “free” solar and wind is more expensive than without it? And having renewables on the grid actually forces us to burn more fossil-fuel gas?
A: Yes, and yes.
Q: What about batteries? Can’t they fill in the blanks for solar and wind?
A: No. Electricity produced by all grid-scale batteries in California is shown by the yellow line (it’s hiding behind the graph’s x-axis). For the purpose of making any significant contribution to grid electricity, batteries are useless.
California’s nuclear plant, Diablo Canyon, is scheduled to permanently close in November 2025, to allow investors to build other more profitable ways to generate electricity. Now, when they tell you their ways will lower carbon emissions and you tell them they’re wrong, you’ll be able to tell them why.

RELATED ARTICLES
-
 July 3, 2020
 -
 July 31, 2020
 -
 August 13, 2020
Thank you, Carl. For educating the public on how power grids operate and why the Green New Deal is such a boondoggle of historic proportions.
Q: Why is the legislature making decisions that should be made by engineers?
A: Because they think the major of Political Science is real science.
Comrades
You don’t rule, and each day brings more than subtle coercion ala electric cars, Coastal Commission, Command Economy , brain drain exodus, tax/tax then free checks for the huddled masses. Dependency all around.
Oddly enough, I received an email survey from UC Berkeley. No idea how I was chosen, and yes, I made sure it was legit.
Questions asked my favorable or unfavorable opinion on the Diablo Canyon nuke plant, did I think California should use more or less nuclear energy, did I think work should continue (therefore spending billions more) on the high-speed rail system. It also asked where I placed “climate change”, “crime”, “immigration”, and “inflation” in my “daily life” priorities. Would gas prices cause me not to go to work (it that a real excuse? I can’t come in this week because I can’t afford gas??) or not drive somewhere, I’d normally drive to. Do I use “public transportation” more because of higher gas prices? NO! “Why not?” Because I can’t fit 6 bales of alfalfa on the bus!
Anyway, if UC Berkeley is honest with survey results, I hope more people would rather keep Diablo Canyon up and running!
Michele1L – Was it the IGS-Berkeley poll? If so, they have done good work in the past. I checked out their methodology when they did the sanctuary state one years ago and it was sound. Most CA polls you look at are not exactly objective, either because of the types of questions they ask and that sort of thing. Don’t know if the IGS-Berkeley outfit are still honest and thorough and good, but they could very well be. Let’s hope for the best! I’d like to know the results from this one. We’re at a crucial time with all of the issues you listed.
Showandtell, my main concern about the IGS poll is that they rely on email addresses maintained by the SoS voter registration rolls. The sampling therefore tends to favor younger registered voters and Democrats. This sampling bias would affect the results since older Republican registered voters would be under-sampled; because this group is less likely to voluntarily provide email addresses to the database.
Thanks Raymond —- something to keep in mind.
Michele1L, thanks for your comments.
The questions on Berkeley’s survey show the disconnect between policy wonks and the workers driving California’s economy, who are trying to make ends meet while paying some of the highest energy prices in the U.S.
Those in Sacramento promoting California’s “energy transition” somehow believe we should all adjust our electricity needs to when the sun is shining or the wind is blowing – that access to clean, affordable electricity is our responsibility, not that of our electricity providers. Of course, the burden falls heaviest on low-income families. And any solution that burdens those least able to bear one is no solution at all.
The grim reality is that the California political food chain winding through the legislator, the agencies, the so-called think tanks, Cal academia, the canvassers and activists who so consistently miss the mark year in and year out – thus sustaining a real mess in everything in one party California – is they are ALL Democrats elected by the same entrenched political machine playing the voters like chips in a casino. Pogo got it right!
Great Article. Thanks.
What caused the Wind and Solar Supply to increase over 4 TIMES in one week. It went from about 6k m/w to over 17k m/w from April 6 to the 14th? Were new machines added to the grid? Was it extra windy or sunny?
And, why did it drop back to 50% a week later to around 7k m/w?
And why couldn’t they keep it at 17k m/w?
John, the numbers at the bottom of the graph represent hours of one day – although it is confusing (the day of the month it happened is also the number of hours in a day).
Lot of good information here. This article helps explain why my electric bill has doubled in three years for the same amount of electricity.