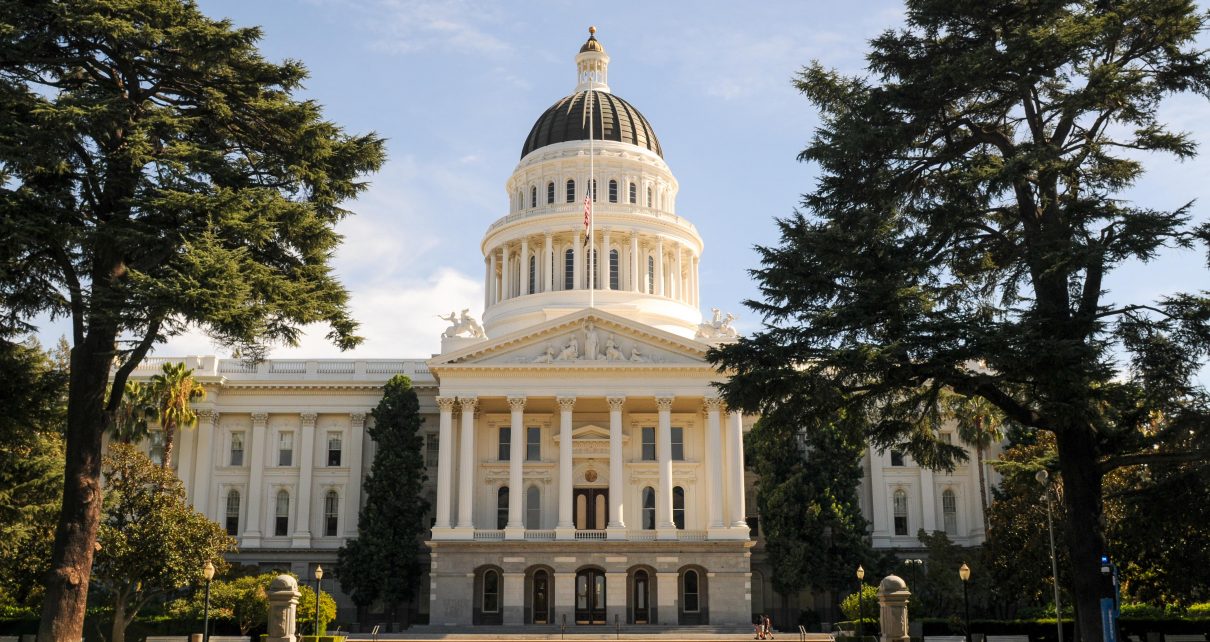
California State Capitol. (Photo: Kevin Sanders for California Globe)
Summary of California Bills Per Session and Actions Taken – 2025 Edition
2025: The Senate passed 864 bills; the Assembly passed 1,533 bills
By Chris Micheli, October 15, 2025 2:00 pm
The following research was updated in October 2025 in order to examine the major actions involving bills in the California Legislature over the few years. I examined the following five categories of information for each year, as set forth in the chart below:
- The number of bills introduced each year of session.
- The number of bills passed by the house of origin (e.g., ABs that passed the Assembly Floor) and the percentage of bills passed by the house of origin in comparison to the number of bills introduced.
- The number of bills refused passage by the house of origin (e.g., SBs that failed passage on the Senate Floor) and the percentage of bills that failed passed on the floor of the house of origin in comparison to the number of bills introduced.
- The number of bills that reached the Governor’s Desk and the percentage of bills that reached the Governor’s Desk in comparison to the number of bills introduced.
- The number of bills chaptered (i.e., signed into law) and the percentage of bills that were chaptered in comparison to the number of bills introduced, as well as the percentage of bills that were chaptered in comparison to the number of bills that reached the Governor’s Desk.
| Number of Bills Introduced (house and year) | Number of Bills Passed by House of Origin (and % of introduced bills) | Number of Bills Refused Passage on the Floor of the House of Origin (and % of introduced bills) | Number of Bills Reaching the Governor’s Desk (and % of introduced bills) | Number of Bills Chaptered (and % of introduced bills; and % of bills reaching Gov’s Desk) |
| Senate – 2025: 864 | 600 – 69% | 0 – 0% | 364 – 42% | 318 – 36.8% and 87% |
| Assembly – 2025: 1,533 | 936 – 61% | 0 – 0% | 549 – 35.8% | 476 – 31% and 86.7% |
| Senate – 2024: 639 | 540 – 84.5% | 2 – 0.3% | 415 – 65% | 349 – 54.6% and 84% |
| Assembly – 2024: 1,520 | 936 – 61.6% | 0 – 0% | 791 – 52% | 668 – 44% and 84.4% |
| Senate – 2023: 891 | 659 – 74% | 0 – 0% | 381 – 42.7% | 330 – 37% and 86.6% |
| Assembly – 2023: 1,771 | 1,056 – 60% | 1 – 0.05% | 665 – 38% | 560 – 31.6% and 84.2% |

Chris Micheli is an attorney and lobbyist with Snodgrass & Micheli, LLC, as well as an Adjunct Professor at McGeorge School of Law.
Latest posts by Chris Micheli (see all)
- Property Boundaries - July 30, 2026
- Incidents of Ownership - July 29, 2026
- Wills in California - July 29, 2026
RELATED ARTICLES
-
 September 30, 2025
 -
 October 10, 2024
 -
 October 2, 2024