
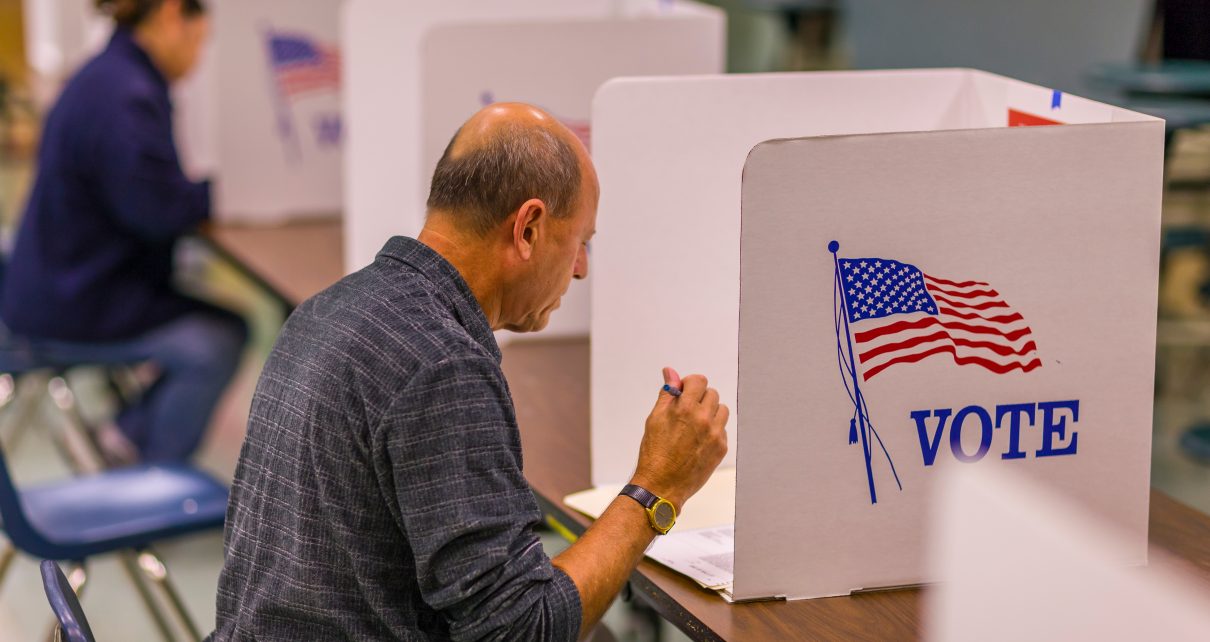
Voter at polls during presidential election, using paper ballots. (Photo: Rob Crandall/Shutterstock)
The Polling Paradox of 2026
How the most-polled midterm in American history became the least predictable — and why the numbers themselves are now a campaign weapon
By John Feliz, August 8, 2026 7:38 am
Eighty-nine days before the midterms, the single most-watched number in American politics cannot agree with itself. CNN’s poll with SSRS puts Democrats ahead by eight points on the generic congressional ballot. Emerson College says eleven. The Washington Post-Ipsos survey says three, and Reuters/Ipsos says two. These are reputable shops fielding in the same weeks, asking essentially the same question, each carrying a margin of error near three points. A nine-point spread among them is not sampling noise. It is a disagreement about what the American electorate actually is — and somebody’s model of that electorate is wrong.
The aggregate tells the same story in slower motion. The RealClearPolitics generic-ballot average stood at D+7.4 on June 1 and had slipped to D+4.7 by late July. Nothing happened in those seven weeks that plausibly moved three points of the national electorate. What changed was the mix of pollsters releasing surveys and the choices inside their weighting decks. When the average moves because the inputs churn rather than because voters do, the average has stopped measuring the race and started measuring the industry.
The paradox, stated plainly
Here is the paradox I have been working through in my own notes on this cycle:
- First, public polling has shown a propensity to favor the anti-Trump respondent. The people angriest at the administration are the ones most eager to spend eighteen minutes with a survey taker, and no weighting scheme fully cures a response pool that self-selects on intensity.
- Second, Democrats have simultaneously been cast — effectively — as left-leaning and pro-socialist, a brand liability that operates underneath the horse-race numbers.
- Third, these two forces together have confounded midterm predictions and tainted the generic ballot as an instrument.
- Fourth, voters may be upset with the president and the economy while remaining deeply skeptical that Democrats would be any better — or suspecting they would be worse.
- Fifth, the practical result is a pure toss-up for control of Congress, no matter what the toplines say.
The data backs the skepticism embedded in that framework. In the same Economist/YouGov survey that shows a six-point Democratic lead, 27 percent of respondents are undecided, backing another candidate, or not planning to vote at all. Emerson finds “threats to democracy” overtaking the economy as the top voter issue — 28 percent to 27 percent — which is less a policy verdict than a portrait of an electorate voting against things rather than for them. An angry electorate that trusts neither party is precisely the electorate that polling instruments handle worst.
We have seen this movie before
Twenty years ago, in January 2006, I broke down an AP/Ipsos poll that carried the headline “Voters Seem More Ready To End GOP Control Of Congress.” The topline was dramatic: a 49–36 Democratic advantage on control of Congress. The crosstabs were the story. The sample leaned 52–40 toward Democrats in a country that had split its 2004 electorate 37–37. Nineteen percent of respondents claimed no religion, against 10 percent of actual 2004 voters. Rural voters — a 57–42 Bush constituency — were 17 percent of the sample but had been 25 percent of the electorate. Married voters were underrepresented by seven points; the under-$15,000 income bracket was overrepresented by nearly double. Every single skew ran the same direction.
The question I asked then is the question that defines 2026: was the purpose of conducting the poll to get good results, or to push an agenda? The mechanics have changed — the landline is dead, the online panel is king — but the game is identical. The difference is that in 2006 you could catch it by reading the demographic tables. Today the skew lives somewhere harder to audit: the weighting deck.
Where the skew lives now
The most honest demonstration of this came, to his credit, from a pollster. G. Elliott Morris ran his own Verasight polling data through four defensible party-weighting schemes — same interviews, same questions, same field dates. The published result was D+7.1. Re-weight to an updated three-way party-ID target and it becomes D+7.9. Weight leaned partisans into their parties and it is D+8.7. Pin a five-way party distribution to Pew’s benchmark and it reaches D+9.2. Two full points of margin — the difference between a competitive House and a wave — produced not by a single voter changing his mind, but by an analyst choosing among equally respectable assumptions.
Rasmussen’s Fran Coombs said it without embarrassment back in 2016: run the same raw numbers through a model with slightly more GOP turnout among men and older voters and Trump leads by one; run it with a few more young voters and women and Clinton leads by four. “Same numbers, slightly different formula, different results.”
Underneath the weighting problem sits the deeper one: nonresponse. The American Statistical Association’s guidance is blunt — a low response rate produces more questionable results than a small sample, because there is no scientifically valid way to infer what the nonrespondents think, and weighting adjustments “should not be considered a complete solution”. Public polls now routinely complete interviews with a low single-digit percentage of the people they attempt to reach. At that point the poll is no longer a measurement wearing a margin of error; it is a model wearing a survey’s clothes. The margin of error describes the sample. It says nothing about whether the sample was ever the electorate.
Polling as a campaign weapon
All of this would be a methods seminar if polls merely described races. They do not. They shape them — and every operative on both sides knows it. A released poll is an intervention in the race it claims to observe, and it skews elections through at least four channels.
- Money and recruitment. A D+11 headline moves donor dollars, PAC targeting decisions, and candidate recruitment months before a single vote is cast. Early polls decide which challengers get funded and which districts get written off — which is why the incentive to publish a favorable number is strongest precisely when the number is least reliable.
- Enthusiasm and complacency. A manufactured blowout tells one side’s marginal voters the race is over. Whether the intended effect is demoralization of the trailing side or complacency in the leading one, the target of a skewed topline is never the forecaster — it is the low-propensity voter deciding whether Tuesday is worth the trip.
- Narrative laundering. The outlier gets the headline; the correction gets the footnote. CNN’s D+8 among registered voters becomes “Democrats surge” across a hundred downstream outlets, while the Post-Ipsos D+3 — fielded days earlier — barely dents the narrative,. By the time the averages digest both, the frame is set.
- Expectation-setting. Polling now also functions as pre-litigation. Gallup finds 67 percent of Americans concerned that political leaders will pressure election officials to change outcomes. In that environment, a party’s polling narrative doubles as its post-election argument: a loss that contradicts months of favorable toplines becomes, to its voters, presumptive evidence of theft. The skewed poll does its most dangerous work after the election, not before it.
The tell is the difference between public and private research. Campaigns treat their own survey work the way the Army treats reconnaissance — continuous, unglamorous, and ruthlessly honest, because a commander who lies to himself gets people killed. Private tracking polls exist to inform decisions. Public polling, increasingly, exists to influence them. That distinction is the whole ballgame.
The information war is already on the record
None of this is a private theory of mine. Salena Zito documented the pattern in the Washington Examiner after the 2024 election, and called it what it is: an information war in which polling is a weapon. Her lead exhibit is instructive. Days before the 2024 vote, Ann Selzer — then treated as the gold standard — published an Iowa poll showing Kamala Harris up three points in a state Donald Trump had carried by eight in 2020. The New York Times, the Washington Post, the Wall Street Journal, and Politico gave it saturation coverage as a November surprise. One hour earlier, an Emerson poll had shown Trump up ten in Iowa. It was barely noticed. Trump won the state by 13.2 points — the ignored poll was nearly right, and the celebrated one was off by sixteen.
Zito traces the same pattern back through the cycle before it: an ABC News battleground poll in the final days of 2020 showing Joe Biden up seventeen points in Wisconsin — a state he won by half a point — and forward through the institutional campaign against the outlets that got it right. FiveThirtyEight dropped Rasmussen from its averages; Rasmussen and the Wall Street Journal were the two shops that called the 2024 popular vote almost exactly. RealClearPolitics, whose averages have been reliable for two decades precisely because they refuse to filter pollsters by pedigree, was attacked in the New York Times and stripped from Wikipedia’s 2024 polling page for “bias” — despite conducting no polls of its own. Her conclusion is the one that matters for 2026: news organizations fighting this war “are not being honest to their readers about the fact that they are just using the poll results they like and ignoring the results they don’t like”. That is narrative laundering with a press badge, and it is the environment into which every generic-ballot number this cycle is being released.
Even an honest topline cannot deliver what it promises
Suppose the generic ballot were measured perfectly. It still would not tell you who controls the House, because the American system does not convert national preferences into seats in any linear way — mathematicians from Condorcet to Kenneth Arrow have proven that no districted voting system can. The 2026 version of that old theorem is concrete: Nate Cohn estimates Democrats need to win the national popular vote by roughly 3.1 points just to barely flip the House, after a round of mid-decade redistricting engineered to minimize Republican exposure. The New York Times’ own panel of pollsters and pundits concedes that a six-point Democratic lead — roughly where their tracking sits — portends a majority but nothing like a wave, and that without the new maps the GOP would be staring at a 25-to-30-seat loss. The redraw is no abstraction in California. The Proposition 50 map — upheld by the Supreme Court in February — targets five Republican-held seats, and the analysts’ watchlists now run straight through the Central Valley and San Diego County. By design, the new lines leave as few as four safely Republican districts out of fifty-two. Control of the House runs through this state, which means every skewed national topline is, functionally, a California story: the numbers being weaponized in Washington are aimed at turnout in Fresno, Kern, and Riverside counties. The polls are the soft half of the skew. The hard half was drawn onto the maps in advance, and no survey instrument can weight it away.
Watch turnout composition, not toplines
There is a better way to read a race, and it starts by abandoning the fiction that a district — or a country — has one partisan lean. It has a different lean at every turnout level. In my firm’s legislative work, we ranked districts by their “flip score”: the turnout-propensity level at which the registration advantage flips from one party to the other. Correlating raw registration advantage with final vote share explained 41.5 percent of the variance. Flip scores explained 71.7 percent. The composition of who shows up beats the composition of who exists, and it is not close.
That is the lens for November. The indicators worth watching are the ones no weighting deck can manufacture: the enthusiasm differential (CNN finds Democrats with a 20-point edge among voters extremely motivated to cast ballots); which side banks a built-in lead in early and absentee voting; where in-state small-dollar money flows in the final six weeks; the demographics of the undecided vote; and — in a cycle where two-thirds of the country worries about pressure on election officials — which party controls the electoral and judicial apparatus that will adjudicate the close ones.
The paradox, resolved
Two things are true at once, and 2026 requires holding both. The public polling is skewed — in its response pools, its weighting discretion, and its function as a persuasion instrument. And Democrats are probably ahead anyway. The paradox is that the public numbers cannot tell you how much of the lead is real, because the same releases that measure the advantage are being used to manufacture it. An honest reading of the reliable indicators — enthusiasm, money, turnout mechanics, and maps — lands where my August note did: a Democratic-leaning House fight, a Republican-leaning Senate map, and a pure toss-up for the shape of Washington next year.
A poll is an argument wearing a lab coat. The question I asked of AP/Ipsos in 2006 — was this conducted to get good results, or to push an agenda? — now has to be asked of every public release in the cycle. In 2026, too often, the answer is both. Read the crosstabs first. The topline is the last thing you should believe.

- California Is Already Holding the Democrats’ 2028 Primary - October 6, 2026
- The Oldest Consultant Reads the Crosstabs - August 25, 2026
- The Broken Compass and the Centennial Catastrophe: A Polling Industry that Keeps Promising Outcomes it Cannot Deliver - August 15, 2026
RELATED ARTICLES
-
-

-
 April 17, 2025
Everything about voting and politics is not to be trusted as input bias and cheating by the “progressives” is endemic to the topic.
Polls are wesponized as psyops to demoralize the opposition….
Who the eff cares what these bought and paid for pollsters sell….
They cut the pattern to fit the cloth….
I’ve seen what’s happened since 1975: Foreigners who will work for nothing and will tolerate bad treatment and bad working conditions.
Then there’s the skill factor. Some are craftsmen, the majority produce mediocre to shoddy workmanship. They can be reluctant to teach anyone other than family and friends how to do things because “then you will take my job.”
There are few mexican males who will say they don’t know how to do something, so the tactful way around that with the unskilled is to say “this is how I want you to do this” and show them.
When they are few in a work group they work at getting along, but when they are in a majority they tend to push out everyone else. It’s like if you are culturally american, you are wrongfully trying to take what they believe iare as foreignerdn the united states, their rightful jobs.
The Polls are increasingly irrelevant because they only sample live voters. As recent elections have shown, voters only represent 2/3 of the electorate. Election results in NYC and elsewhere show that voter bots, migrants, dead people and virtual voters’ case an increasing fraction of the votes.
The polls are just as corrupt and bogus as the elections. Neither can be trusted.
Old news. Polls are weapons. One thing you left out. The polls are used to cover the cheating. An example was the fake election of Biden.