
California Bear Flag. (Photo: ca.gov)
How Much do California’s State Workers Make?
Lower pay and benefits to public employees might also trigger a long overdue political awakening
By Edward Ring, November 4, 2020 2:15 pm
Californians pay the highest overall taxes in the United States, with more to come. The Democratic supermajority in the state legislature is considering AB 1253 that would raise the top income tax rate to 16.8 percent, and AB 2088 that would impose an annual 0.4 percent tax on any California resident’s net worth in excess of $30 million.
On the ballot, voters are being asked to approve Prop. 15, which will reassess commercial properties at current market values to calculate their property taxes, and Prop. 19, which will trigger reassessments of inherited homes unless the heirs intend to live in them.
Also on the ballot in cities and counties throughout the state, are nearly 300 proposals for new taxes and bonds which, if approved, will add billions in new local taxes and tens of billions in new local borrowing.
The reasons that California’s politicians have an insatiable need to raise taxes are many and complex. But principal among them is the fact that California’s state and local government employees enjoy rates of pay and benefits significantly greater than that of the citizens they serve. With the long-term economic impact of the pandemic lockdown likely to put additional strain on public sector budgets, cutting pay and benefits must be an option along with cutting services and raising taxes.
How Much Do California’s State Workers Make?
In two earlier reports, using data provided by the California State Controller, the average annual pay and benefits for full-time county workers in 2019 was calculated, overall, to be $126,000; for full time city workers the average was an astonishing $151,000. Meanwhile, with state agency payroll data now available from the California State Controller, the 2019 average annual pay and benefits for full time state workers was $143,000.
The following table shows average full time pay and benefits, broken out by the 25 largest state agencies in terms of headcount, and sorted with the highest averages first:
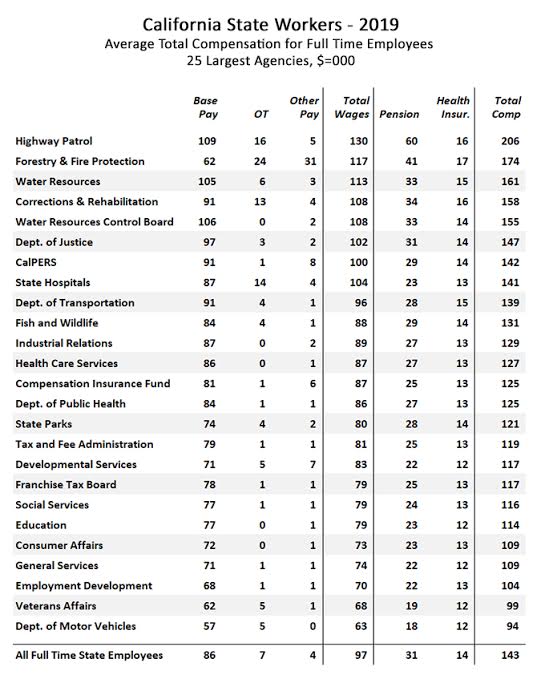
The first thing to take into account when studying these averages is the fact that they understate the actual compensation these employees receive. This is because pension contributions are understated, prefunding of retirement health benefits are not included, and the value of more public sector paid days off is not taken into account.
Comparing Public vs Private Sector Compensation
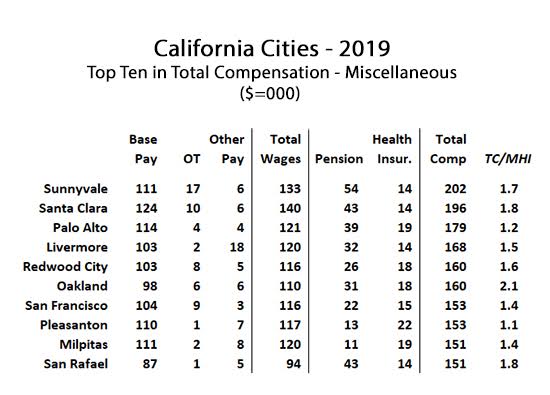
In earlier reports, the (understated) average public sector compensation calculations for 2019 were compiled by select cities and counties, comparing them to the median household income for those same cities and counties. To quantify this relationship, the ratio “TC/MHI” (which stands for “Total Compensation / Median Household Income”) was calculated, with the median household income for each city taken into account as the denominator, and average public employee compensation as the numerator. If the ratio is greater than one, then the average public employee in that city is making more than the median household earns. On the next six charts, that information is presented.
The first two charts present this data for “miscellaneous” employees, which are all public employees that are not members of public safety. As will be seen, these are the lowest averages, but even in these cases, the average public sector compensation is typically more than 50 percent greater than the median household income in the same locales. Here is the data for the cities in California with the highest reported public sector compensation. As can be seen, these are some of California’s wealthiest cities:
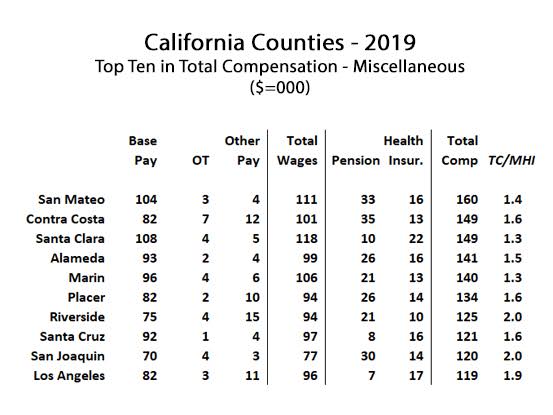
And here is the data for the counties in California with the highest reported public sector compensation:
When comparing public and private sector compensation in California, using the available data, it is important to recognize that for four reasons, the reported disparity is understated:
1 – The unreported costs for underfunded pensions, retirement health insurance, and the value of more paid time off result in public sector pay averages that are much lower than what is actually the case.
2 – The difference between average and median compensation results among California’s public sector workers is relatively insignificant, whereas in the private sector, averages are pulled way up by a handful of very wealthy individuals. In fact, median compensation results for public safety employees are often lower than the averages for the same set of records.
3 – The comparison is between average individual earnings in the public sector and median household income in the private sector. California’s households average more than one wage earner, meaning the median (or average) individual private sector earnings are much lower than the household income.
4 – There are 2.5 million public sector workers in California, nearly 14 percent of the 18.5 million total labor force. Their compensation is included in the average household income statistics, pulling the results up higher than they would be if only accounting for private sector households.
Average Compensation for Public Safety Employees
While “miscellaneous” public employees collect pay and benefit packages that are over 50 percent greater than their private sector counterparts – much more if you take into account the reasons their compensation is underestimated – that disparity is dwarfed by the TC/MHI ratio for California’s public safety employees.
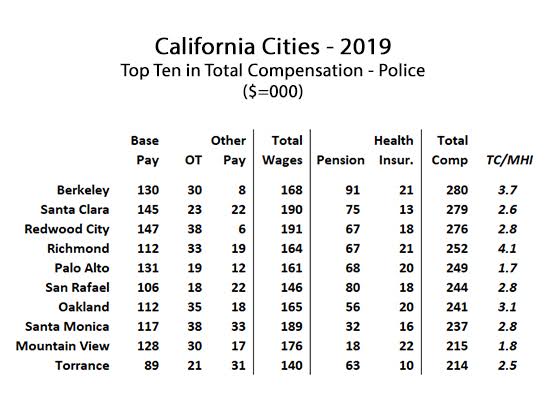
The next four charts look again at the top ten cities and counties in terms of public sector compensation, starting with sheriff compensation in California’s counties.
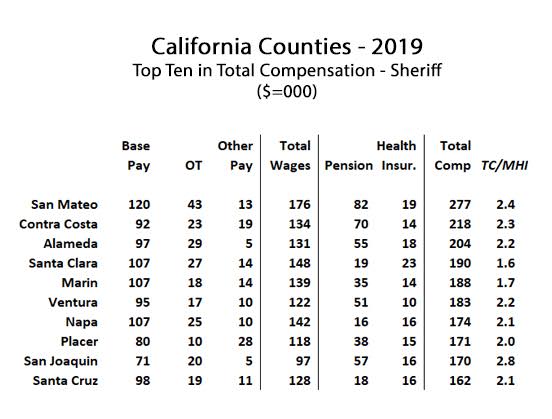
With California’s sheriffs and police coping with the pandemic, social unrest, and political attacks on their ability to do their job, it is not necessary to belabor their compensation issues. Especially since police and sheriff compensation in California is consistently and significantly lower than firefighter compensation, in spite of their jobs delivering more stress, harder work, and equivalent levels of on-the-job injuries and fatalities.
What should be observed, however, is the fact that overall, police and firefighter compensation are at levels that leave very little flexibility to cope with current and future challenges to public safety. Consider the City of Berkeley (below), where the average full-time police officer earned pay and benefits of $280,000 per year in 2019, 3.7 times the median household income in that city.
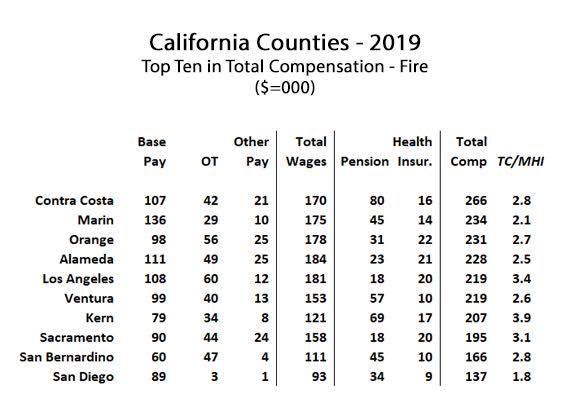
The next table shows California’s top ten counties for firefighter compensation. Notably absent is San Mateo County, and the reason for that bears further explanation. Unlike sheriffs, for which every county has a department, many fire agencies exist as special districts that are either fully independent or partially independent of county administration. In California, in addition to city fire departments and county fire agencies, there are 102 fire protection districts or fire authorities. In San Mateo County, individual city fire departments provide a large percentage of the firefighting capacity.
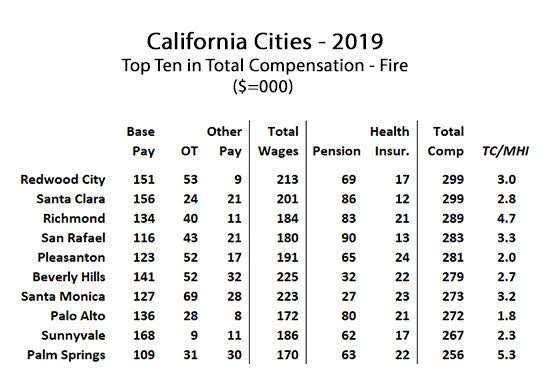
When it comes to public sector compensation in California, no job category is more lucrative than working as a firefighter in a California city. The next chart shows average total compensation for the ten highest paying cities in the state. Every one of them report average pay and benefits in excess of $250,000 per year, bearing in mind, again, that the totals do not take into account the true cost to taxpayers to pre-fund their pensions and retirement health insurance benefits.
The intended message underlying the presentation of all this compensation data is that California’s local governments cannot hope to weather the economic storms that have just begun unless they cut pay and benefits, along with cutting headcount and cutting services. While making less is never palatable to those affected, it may be more digestible than coping with inadequate human resources to cope with challenges to the public, whether they’re fires, unrest, or social hardship.
Lower pay and benefits to public employees might also trigger a long overdue political awakening among these people, whose unions are largely responsible for promoting politicians and policies that have imposed on Californians the highest cost-of-living in the nation. Perhaps public employees could afford to make less, if they made less, because they’d start supporting politicians that would create more competitive, affordable markets for housing and energy.
As noted in several reports published earlier this year, one city in Orange County, Placentia, was able to put their fire department onto a financially sustainable path by breaking free of the Orange County Fire Authority. Instead they formed an independent fire department, where they dramatically reduced operating costs through the use of trained volunteers, hiring part-time firefighters to reduce overtime costs, contracting with a private ambulance service, and replacing pensions with a 401B defined contribution plan. The performance of this innovative fire department going forward should be closely watched.
There are analogues to what Placentia did with fire protection services across all public sector disciplines. Where are job descriptions too narrowly defined? Where do opportunities to contract with private sector services make operational and financial sense? What services and functions can be eliminated, such as the ridiculously bloated administrative overhead in public schools?
Asking these questions is unpleasant. Implementing them is hard. But California’s public agencies need to think creatively, and make some hard choices, because now more than ever, it is in the public interest.


- Ringside: Dredging the Delta Can Prevent a Catastrophe - July 22, 2026
- Ringside: Commercializing Hydrocarbon Production from Air and Water - July 16, 2026
- Ringside: The Dismal Economics of Floating Offshore Wind - July 9, 2026
RELATED ARTICLES
-
August 1, 2020
-
 July 29, 2020
 -
 July 22, 2020
C’mon, Edward. You can do better.
Even Breitbart, and others of the ilk, have come up with scarier numbers.
California Employer Cost of Employee Compensation, Dec. 2020
Private sector workers … $36.23 per hour
State and local workers…$53.47 per hour
That’s a 48% advantage right there, and it includes (ostensibly) benefits and paid time off. Myriad almost irrelevant reasons these figures are off.
For one, most governments are “large employers” (500 workers or more). According to BLS… Private workers…$53.83 per hour (side note, “paid leave is worth $4.91 /hour, vs. $4.04 for state and local workers)
Overall, large private establishments earn slightly more than public workers -including- more paid time off, ceteris paribus.
The big dichotomy is not between public and private workers, but between large employers and “all employers”. (note, ” all employers ” includes large employers.)
It gets worse:
“small employers (1-99) earn only $29.99/hr, including $1.88 for paid time off.
So -either- large employers or public workers earn 80 percent more than workers in small establishments.
It’s a large and complicated comparison, Mr. Ring. Easy to mislead, whether intentional or not.
That being before you get to the boilerplate BLS caveat:
“Compensation cost levels in state and local government should not be directly compared with levels in private industry. Differences between these sectors stem from factors such as variation in work activities and occupational structures.”
The “apples and oranges” problem.
In 2012, the GAO published a “study of studies” comparing public and private pay, including:
human capital approach (3 studies)
job-to-job approach (2 studies)
trend analysis approach (1 study)
GAO Report to Congressional Requesters
Results of Studies on Federal Pay Varied Due to Differing Methodologies
June 2012
If you guessed that all studies had differing results (and all different from yours), I will send you a cigar.
And it is true. Police and firefighters on average make much more than other public workers, primarily because they retire earlier, sometimes mandated so. Early retirement has been a feature of military and safety retirement in the U.S. and most other countries since Hector was a pup.
The 1948 Hook Commission stated this purpose well [5, p. 40]:
a sound retirement system is essential to solving the superannuation problem. The services must be kept young, vigorous, and efficient: a sound retirement plan with a proper compulsory retirement age will permit youth and brains to rise to the top in time to be effective…. Other concepts of retirement for those taking up the profession of arms are also important and have been taken into consideration but the Commission does not consider them to be controlling.
And it is expensive.
What ever happened to California workers make TWICE as much? You’re not helping.
And, every survey, calculation, study, or educated guess that purports to say whether the average public sector or private sector worker is overpaid, is missing vital context.
In every state, and every OECD country, there is a floor under public pay and a ceiling over which public pay will not reach the highest private sector pay. Not even close.
At the lower end, public wages will be similar to private wages, but benefits and pensions will give them a decided advantage.
At the higher end, public workers will earn lower wages than equivalent private sector workers, and the greater pensions and OPEBs will not be enough to compensate for lower wages.
In the middle is a group of public workers whose pay is lower than equivalent private workers, but their higher pensions roughly compensate for the lower pay. Hundreds of thousands of public workers who, even with their “generous” pensions, are neither over nor under-paid. Whether you agree with it or not. Whether you believe it or not, it is logical and incontrovertible. It is ubiquitous and older than any of us. You can’t change it, nor should you.
https://cdn.shopify.com/s/files/1/0894/3444/products/1113972_I_Double_Dog_Dare_you_2048x.jpg