
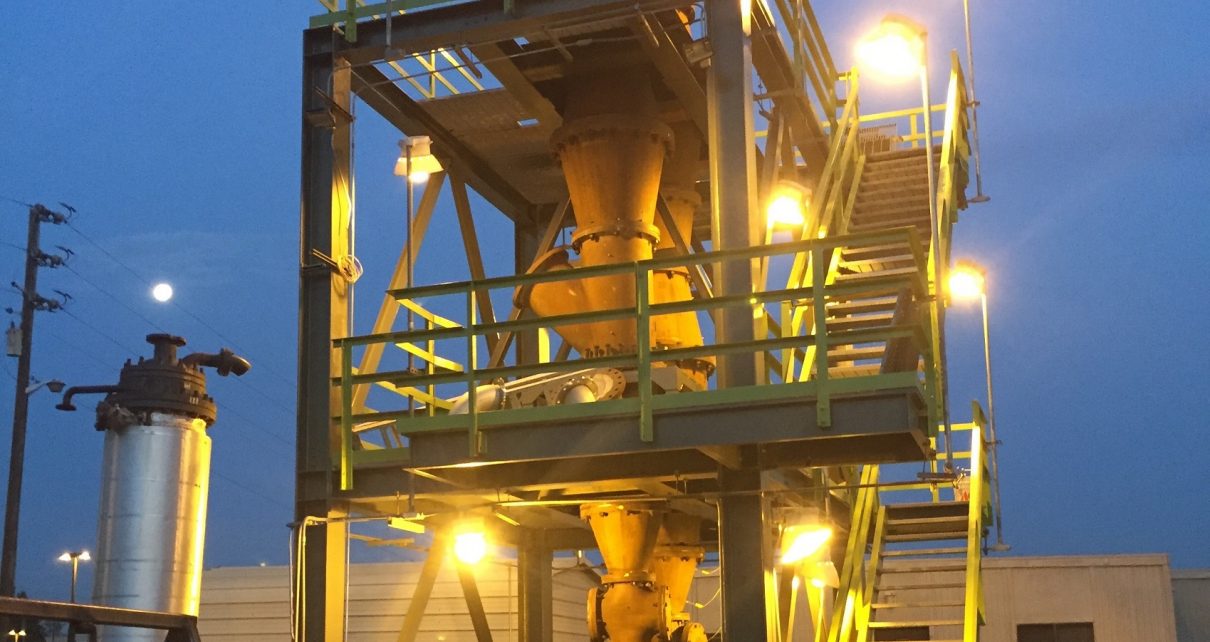
Natural gas production. (Photo: ucr.edu)
Ringside: Where Does California Get its Energy?
If we aspire to abundance and affordability in California and the world, a realistic strategy would be more primary energy, along with more efficient use of energy
By Edward Ring, September 2, 2026 4:50 pm
 Finding quality, consolidated information on energy use in California is surprisingly difficult. The California Department of Energy provides detailed information on electricity production, and a variety of reports on, for example, refinery inputs and production. But there is no report available from official state sources that puts it all together.
This is unfortunate, because as a state determined to mandate a very disruptive transition to a completely new mix of energy sources, how else do we identify trends and measure our progress? How else do we evaluate the impact of state laws and regulations that have profoundly impacted our industries and households?
Conceptually, it’s not difficult. All types of fuel can have the energy they produce expressed using a common unit. Internationally that unit is Joules, and in the U.S. the energy in fuels is typically normalized in BTUs, or British Thermal Units. Rather than delve into the essential nature of Joules vs. BTUs, for our purposes, it’s the proportions that matter. When reporting how much fuel the whole state of California consumes, BTUs must be expressed in trillions, i.e., not BTUs, but TBTUs.
According to the U.S. EIA (Energy Information Administration), in order of quantity, and expressed in TBTUs, here are the raw energy inputs consumed by Californians in 2024:
Petroleum – 2,982 – 45.0%
Natural Gas – 2,013 – 30.4%
Biomass – 690 – 10.4%
Solar – 291 – 4.4%
Imported Electricity – 238 – 3.6%
Nuclear – 192 – 2.9%
Hydro – 100 – 1.5%
Wind – 53 – 0.8%
Geothermal – 38 – 0.6%
Coal – 29 – 0.4%
Total – 6,627
The obvious temptation here is to reiterate just how dependent Californians remain on oil and gas: fully 76 percent of all energy. And to suggest again, of course, that for the sake of energy security, national security, jobs, environmental impact, and to set an example of best practices to a world of nations that aren’t about to stop developing oil and gas, our state legislature should end its relentless attack on our in-state producers and refiners.
But while it is important to acknowledge the ongoing role of oil and gas, we must also recognize how all forms of energy are converted from raw fuel to end-uses. Understanding this process is essential for anyone with more than a passing interest in California’s energy policies.
As it is, one of the best ways to visualize the energy flows specific to California comes from analysts at Lawrence Livermore Laboratory (LLNL). They produce energy flowcharts, by year, for each of the fifty states. A few weeks ago they released updated flowcharts, including one for California, that shows how energy takes that journey, using 2024 data from the U.S. Energy Information Agency.
Perhaps the most important insight that is obvious from viewing the LLNL energy flowchart is that of the 6,627 TBTUs of raw, or primary energy consumed in California in 2024, only 2,358, or 36 percent, ended up as end-user energy in the form of, for example, light, heat, cooling, horsepower, aviation thrust, communications, computations, appliances, pumping water, and industrial uses. The rest of the raw energy is lost in extraction, refining, conversion (such as heating water to drive a steam turbine to generate electricity), transmission and distribution loss, friction, and waste heat in everything from a household appliance to a locomotive.
Something striking about conversion losses is how unevenly distributed they are among sectors. LLNL estimates 65 percent of all energy inputs into California’s residential and communications sectors to be utilized, whereas they estimate 49 percent efficiency in the industrial sector, and a dismal 21 percent efficiency in the transportation sector. These are estimates, and when I asked how they were derived, I was informed “These are simplified, sector-wide LLNL assumptions used to divide delivered energy into energy services and rejected energy. They are not annual California-specific measurements and are not calculated separately for each fuel.”
To be fair, making these estimates is complex. LLNL has not updated them in six years, and it is likely California sector efficiencies are better than the national average. But the 21 percent figure for the transportation sector is illuminating. The average internal combustion engine only converts about 30 percent of the energy in the onboard gasoline into horsepower. The average modern EV will convert roughly 80 percent of the initial battery charge into horsepower. This is a significant improvement and is an argument in favor of EVs. If California’s electricity wasn’t so expensive, and if the price/performance of EVs continues to improve, consumers will increasingly favor them.
One statistic that jumped out on this flowchart was “biomass” constituting 10.4 percent of all primary energy. That seemed very high, particularly since 85 percent of it was in the transportation sector. When I inquired about this, here’s the response from LLNL. “The value is high, but it is not primarily ethanol. EIA’s 2024 California data break it down [for transportation] almost exactly as follows:
Renewable diesel: 426.6 TBTU
Fuel ethanol: 109.4 TBTU
Biodiesel: 31.1 TBTU
Total: 567.1 TBTU”
It came as a surprise that renewable diesel consumption is four times greater than ethanol consumption. But in both cases, we may want to be cautious before assuming either of these sources grow more than incrementally in the future.
Another question raised by the 2024 update to LLNL’s flowchart was how it depicts a negligible amount of electricity going to the transportation sector. In response I learned that the EIA estimates California’s light duty EVs consumed 5,776 gigawatt-hours, equivalent to approximately 19.7 TBTUs. But, and here’s the answer, that electricity consumption was categorized and accounted for within the residential and commercial sectors.
When analyzing energy and considering our energy future, many of us take for granted that the difference between primary energy and end-user energy is generally understood. That can be a perilous assumption. Politicians, political staff, journalists, and activists, much less the typical voter, may or may not have this understanding. But having it adds a necessary context to any discussion of our energy future. To deliver affordability and abundant energy, fulfilling end-user consumption is ultimately the most important goal.
In pursuit of that goal, there is debate between how much primary energy we should develop, and via what fuel, versus how much efficiency improvements can reduce the primary energy required. If we aspire to abundance and affordability in California and the world, a realistic strategy would be attend to both: more primary energy, along with more efficient use of energy.


- Ringside: Observations as a New Water Year Begins - October 8, 2026
- Ringside – Geothermal Energy: A Huge Wildcard - October 1, 2026
- Ringside: El Nino Emergency Planning Must Include Dredging the Delta - September 24, 2026
RELATED ARTICLES
-
 April 17, 2024
 -
 July 31, 2020
 -
 February 29, 2024
Thanks for the heavy lifting you do on this topic. We appreciate it more than you know