
Coronavirus. (Photo: Center for Disease Control)
The Numbers Don’t Add Up in Gov’s More Restrictive COVID Lockdown Tiers
Sacramento, San Diego and Stanislaus bumped to most restrictive tier, even with a drop in deaths
By Katy Grimes, November 11, 2020 12:03 pm
On Tuesday, Health and Human Services Secretary Dr. Mark Ghaly, a cabinet-level secretary in the Newsom administration, announced that 11 Californian counties would be moving into more restrictive tiers as the number of new cases and the positivity rates in those counties have gone significantly up since late October. Sacramento, Stanislaus, and San Diego counties were moved back to the most strict lockdowns.
Why?
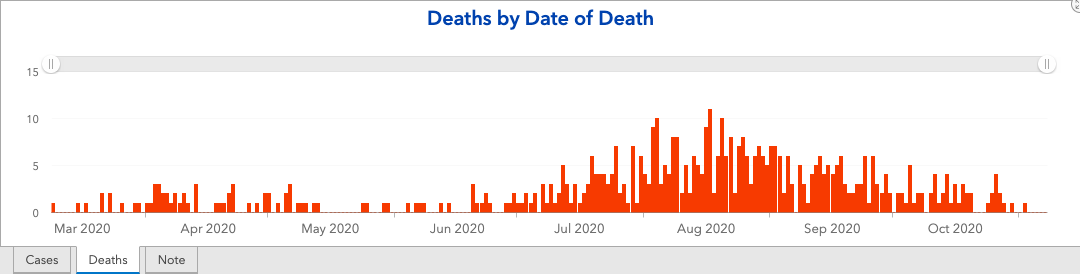
Sacramento County, with a population of 1,567,490 million, has 514 deaths attributed to coronavirus. However, deaths in Sacramento County peaked in August, and have dribbled off since. And according to physicians the Globe has interviewed, the only important measurement are those in the hospital, and those who have died as a result of the coronavirus.
If practicing physicians were driving the decisions in California, lockdowns would be a thing of the past, and admittedly a failure.
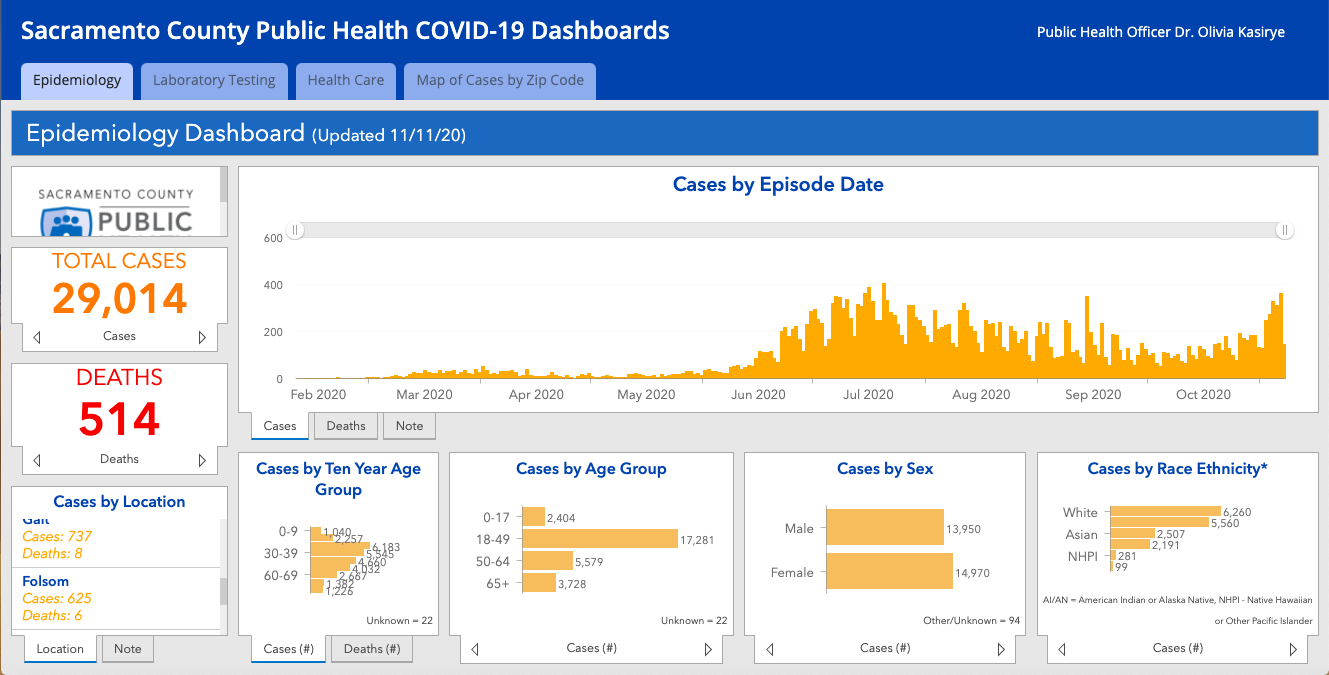
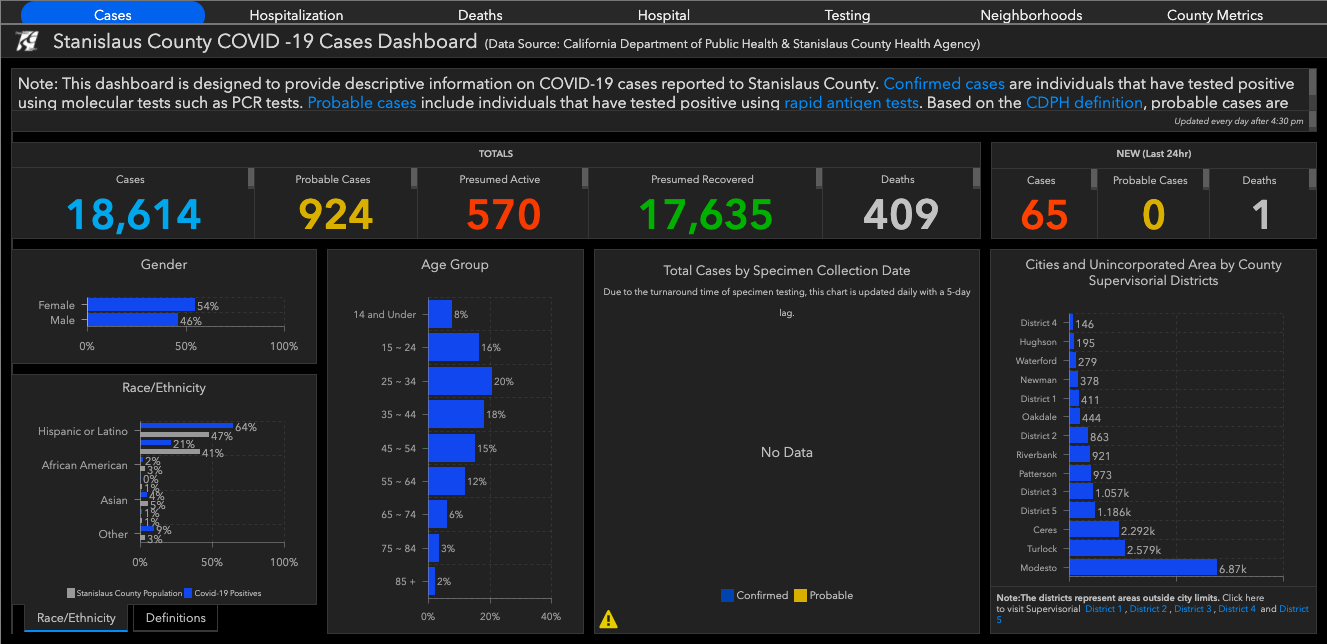
Additionally, as the Globe has reported, children and young people are not only not sick with coronavirus, many epidemiologists say they are not spreaders – as this Sacramento County chart proves:
“Cases” are not hospitalizations or deaths.
Perhaps the most revealing graph is this one showing “positivity” rates – note the yellow “positive” and the blue “non-positive cases.”
Why exactly is Sacramento County closed down?
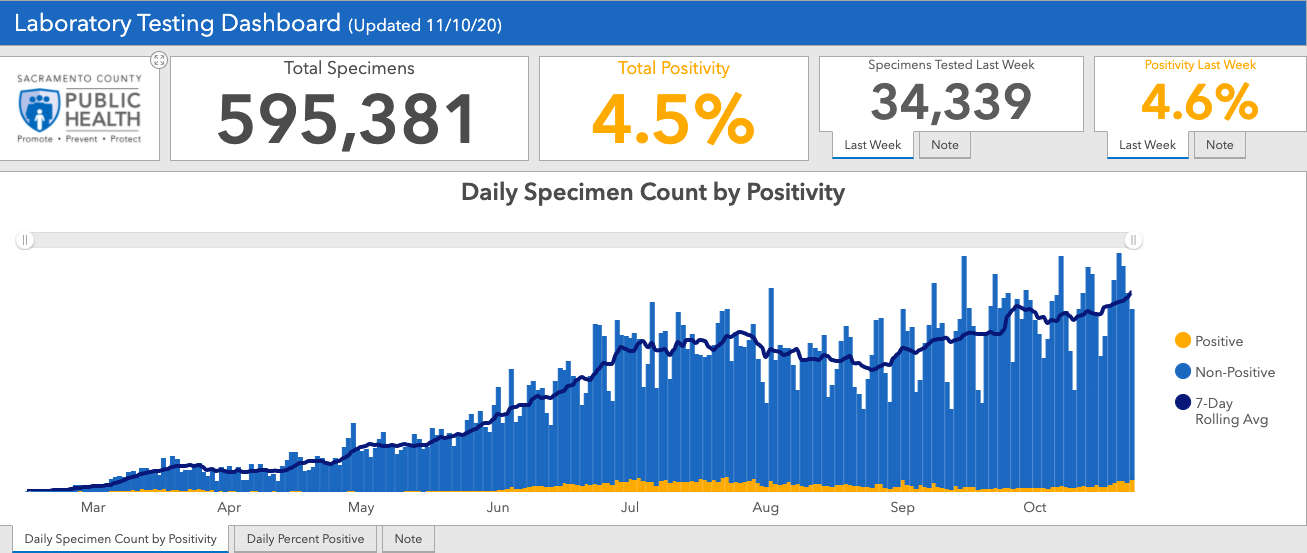
The Sacramento County health director claims the increase in “positive cases” stem from Halloween celebrations. Actually, the real “spike” is in “non-positive” cases.
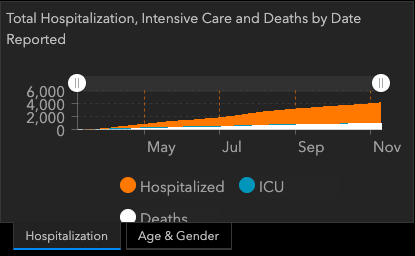
San Diego County is reporting is much the same as Sacramento County – you have to dig for the actual deaths, behind the “cases.”
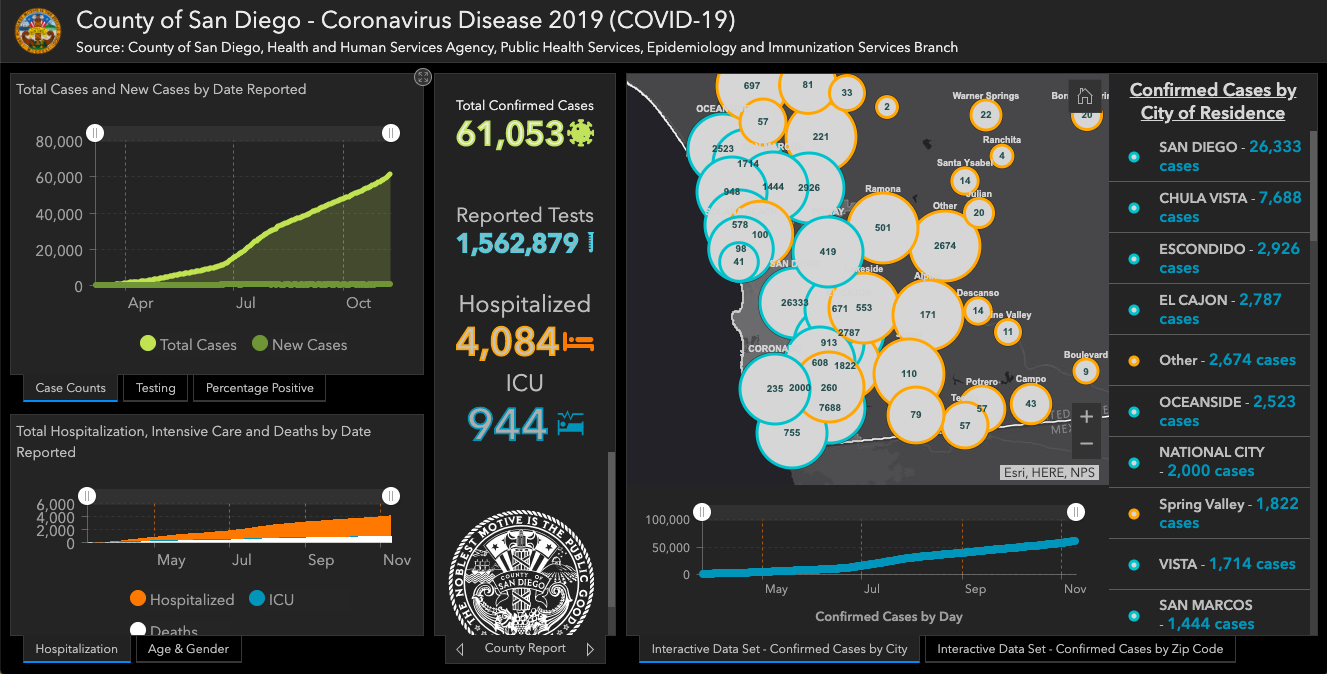
San Diego County, with a population of 3,379,160 million, has had 915 deaths attributed to coronavirus. San Diego County reports 1,562,879 tests given, with 61,053 “confirmed cases.” This also means 1,501,826 San Diegans tested negative for coronavirus.
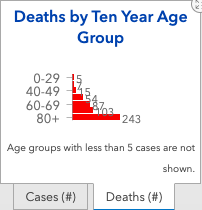
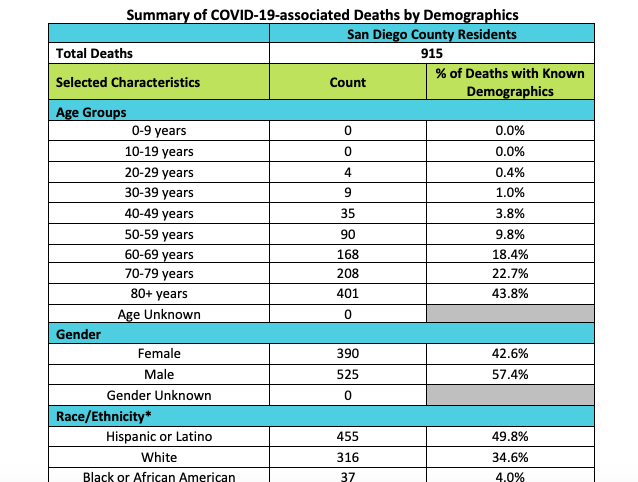
Again, the age breakdown on deaths attributed to coronavirus in San Diego County is as telling as it is in Sacramento County:
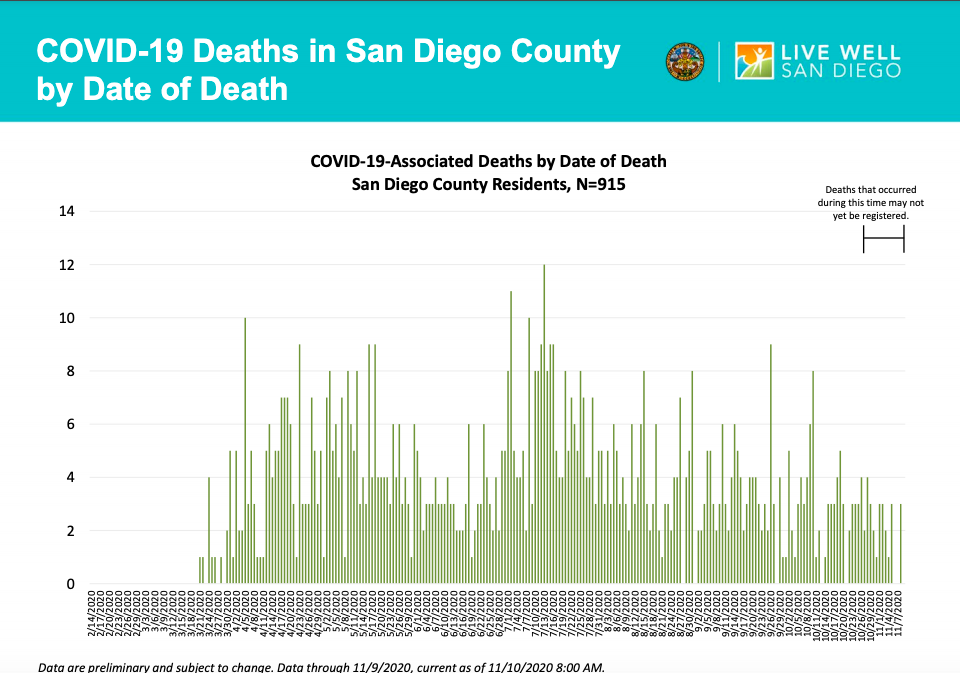
This chart shows a drop in the death rate attributable to coronavirus, down to 3 deaths 11/7/2020:
Stanislaus County, with a population of 558,911, has 409 deaths attributed to coronavirus. The County has tested 127,537 tested, 18,614 positive “cases,” and 17,635 recovered.
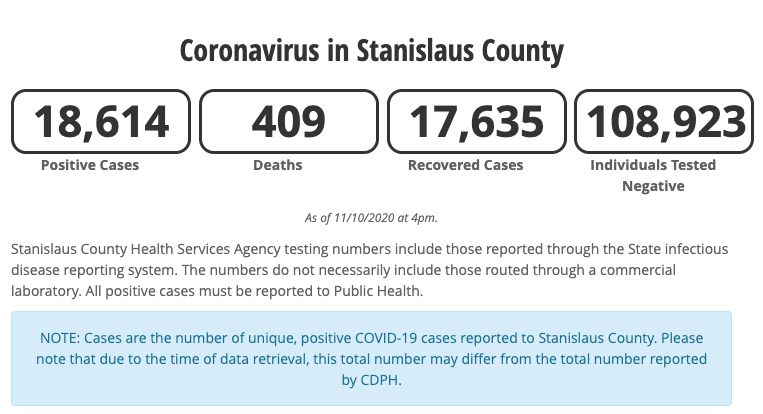
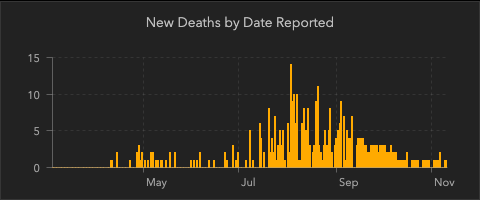
Stanislaus County deaths attributed to coronavirus also peaked in August, and have dribbled down to 1 death November 10, 2020.
The numbers don’t add up at all to warrant further restrictions. What this does add up to is more California businesses closing, more employees on unemployment, and more Californians reliant on government assistance.
As California Globe reported, on Tuesday, the following county changes were made:
Yellow (Minimal) to Orange (Moderate):
- Modoc County
- Siskiyou County
- Trinity County
Orange (Moderate) to Red (Substantial)
- Amador County
- Contra Costa County
- El Dorado County
- Placer County
- Santa Cruz County
Red (Substantial) to Purple (Widespread)
- Sacramento County
- San Diego County
- Stanislaus County

A California native and Navy mom, Katy lives in Sacramento, CA.
- Cal Chamber Endorsed Candidate Xavier Becerra Prioritizes Illegal Street Vendors over Legal Businesses - July 23, 2026
- Don’t You Want to Know Who the ‘Democratic Socialists of America’ Really Are? - July 23, 2026
- No Climate Crisis in California: Climate Change is Not Causing California’s Wildfires - July 23, 2026
RELATED ARTICLES
-

-
 November 11, 2020
 -
Also hearing that people with flu symptoms are now being tested for COVID but not flu as we head into traditional flu season. Thus a “COVID test” magically becomes a “COVID case” even though the testee probably has the flu. You can well imagine what the incentives might be to make annual flu season turn into All-COVID-All-the-Time Season: Money and politics.
Comrades
We should build a Covid Memorial of all businesses that have or will fail naming them individually to remember them, honor them….
Welcome to Agenda 21. The idea is to shut down all businesses and make them owned by the public, to stack-and-pack all individuals into smart city gulags, and to gradually reduce the world’s population, and to erode all independence of thought by making all individuals dependent on an UBI. It’s a Brave New World
https://www.amazon.com/Behind-Green-Mask-U-N-Agenda/dp/0615494544
This scamdemic became pure political theater and fear mongering when the metrics reporting magically shifted from deaths and hospitalization to “cases” over the summer.
This is a farce and a political hit job for political purposes.
Every Californian needs to sign the recall petition and throw these Democrat Governors out of office and fight like hell to keep Biden & Harris out of office…
The more I see hear and read, the more I believe this virus was introduced into the US by a Democrat party in cahoots with the Chinese Communists, in order to destabilize the economy and provide political cover for the Biden crime family and the ChiComs…
This whole situation stinks to high, bloody heaven…
This is political collusion at a global level…
The idea that “the virus was introduced” is part of the propaganda. In a huge complex intelligence operation like this there is a set of “internal stories” that are told to some insiders to get them to go along with the operation by making them think they are secret heros. One of them might be, “oh, it’s a bioweapon.” The fact is the Democrats and the Republicans and the Chinese Communist Party are all sock puppets of the same transnational globalist banking elite, and they are all playing a part to keep the public divided and to make the deception confusing.
The best medical explanation of the deception is by David Crowe. All they’re doing is taking nonspecific pneumonias and reclassifying them backed up with worthless tests:
https://theinfectiousmyth.com/book/CoronavirusPanic.pdf
This is an intelligence operation. Look into Newsom’s backstory and his gap years – he was training for the intelligence community in the early 90’s. He wasn’t elected, he was emplaced. Same with Harris. Moreover, the CA Public Health Department is staffed with Epidemic Intelligence Service assets who are calling the shots. That’s how they can all lie at once. Obviously, this is a very long and complex operation on the level of 9/11 planned over many years, and there are likely internal stories that are told to local officials to get them to go along with it – such as “oh, it’s a bioweapon, so we are keeping the public safe” even when it’s a lie. California Globe is a relatively new news outlet that the national security state probably overlooked in its propaganda program, which is why it’s being skeptical.
At the heart of the deception is a simple reclassification of existing nonspecific respiratory illness/pneumonia as “caused” by a nonexistent virus backed up by psychological manipulation playing into doctor’s trust of lab results, arrogance, and blind trust in authorities. We can now look back and see other fake epidemics in recent years as a dry run for this operation (2009 Swine Flu, 2014 Ebola, 2003 SARS) – it all sets up what’s going down.
So, the big question is: Why? Well, it’s on a global scale, so it’s likely related to transnational power elite, globalism, and banking.
So who cares if case numbers have increased when deaths have decreased? There is a 99.9% survival rate so why are we still in a lockdown? When will the sheep decide not to follow? We should be celebrating the decrease in deaths and heard immunity not closing businesses again? Am I right?
Please report on this. This must be made public.
That’s a question well worth asking. Just how great a price are you willing to pay for the illusion of safety? SARS-CoV-2 has a survival rate of 99.99% for those under the age of 40.3 Even people over the age of 60 who aren’t residents of nursing homes have a survival rate of 98.29%.4
Source: https://www.acpjournals.org/doi/10.7326/M20-5352
Data5,6 also show the overall all-cause mortality has remained steady during 2020 and doesn’t veer from the norm — in other words, COVID-19 has not killed off more of the population than would have died in any given year anyway — yet residents in many areas are now told, in great detail, how they can and cannot celebrate their holidays. Is it worth it?
5 YouTube, SARS-CoV-2 and the rise of medical technocracy, Lee Merritt, MD, aprox 8 minutes in (Lie No. 1: Death Risk)
6 Technical Report June 2020 DOI: 10.13140/RG.2.24350.77125